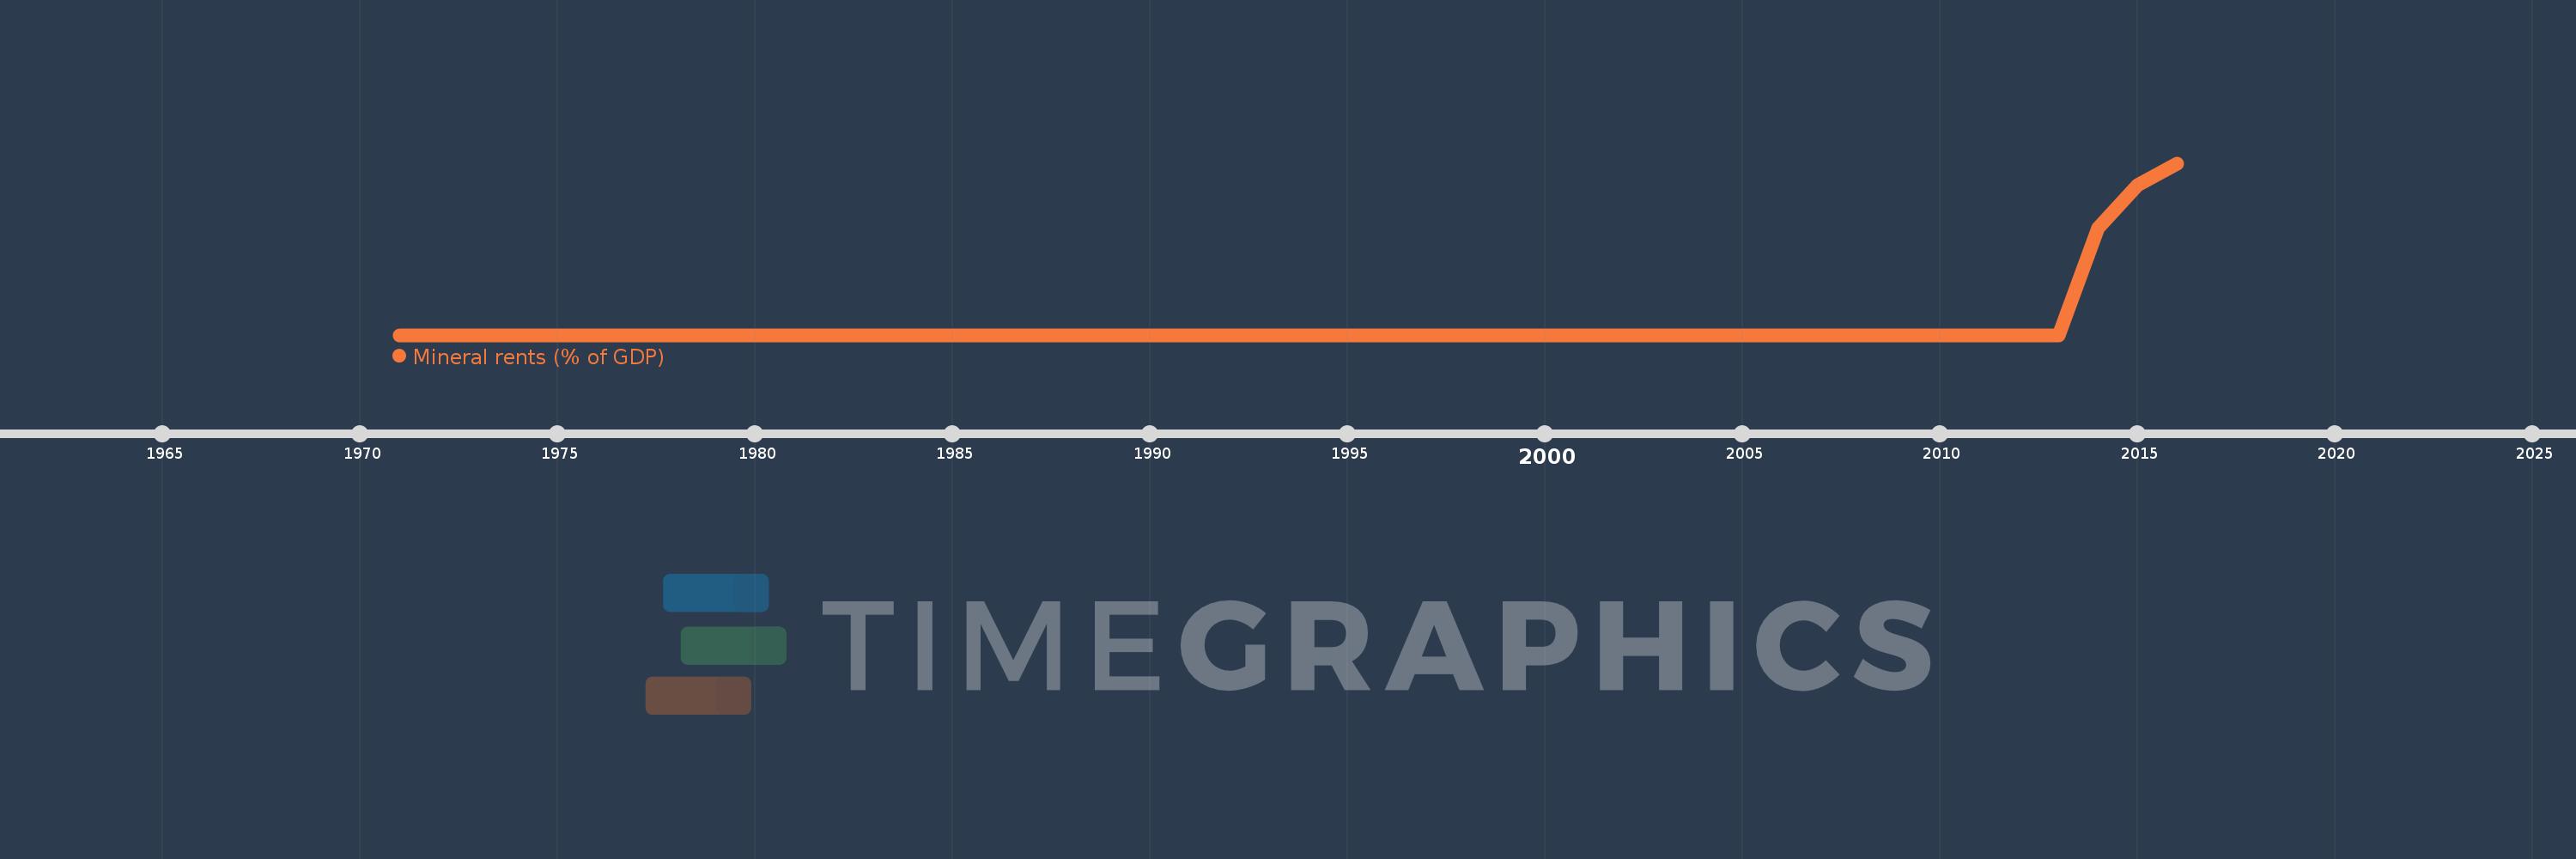
This timeline shows a graph from 1971 to 2016 of Afghanistan. No data until 1970. Number of actual observations by date: 27.
Source name:
World Development Indicators
Source organization:
Estimates based on sources and methods described in "The Changing Wealth of Nations: Measuring Sustainable Development in the New Millennium" (World Bank, 2011).
Categories, topics:
Energy & Mining, Environment
Last updated:
apr 23, 2017
Indicators value changes by year
Meaning:
0.001
Minimum:
0.0
jan 1, 1971
Maximum:
0.008
jan 1, 2016
At the date of observation
Value
Absolute change
Change from the previous value
jan 1, 1971
0.0
0.0
0.0%
jan 1, 1972
0.0
0.0
%
jan 1, 1973
0.0
0.0
%
jan 1, 1974
0.0
0.0
%
jan 1, 1975
0.0
0.0
%
jan 1, 1976
0.0
0.0
%
jan 1, 1977
0.0
0.0
%
jan 1, 1978
0.0
0.0
%
jan 1, 1979
0.0
0.0
%
jan 1, 1980
0.0
0.0
%
jan 1, 1981
0.0
0.0
%
jan 1, 1982
0.0
0.0
%
jan 1, 2002
0.0
0.0
%
jan 1, 2003
0.0
0.0
%
jan 1, 2004
0.0
0.0
%
jan 1, 2005
0.0
0.0
%
jan 1, 2006
0.0
0.0
%
jan 1, 2007
0.0
0.0
%
jan 1, 2008
0.0
0.0
%
jan 1, 2009
0.0
0.0
%
jan 1, 2010
0.0
0.0
%
jan 1, 2011
0.0
0.0
%
jan 1, 2012
0.0
0.0
%
jan 1, 2013
0.0
0.0
%
jan 1, 2014
0.005
+0.005
%
jan 1, 2015
0.007
+0.002
43.45%
jan 1, 2016
0.008
+0.001
15.55%
Ranking of countries by current statistics by years