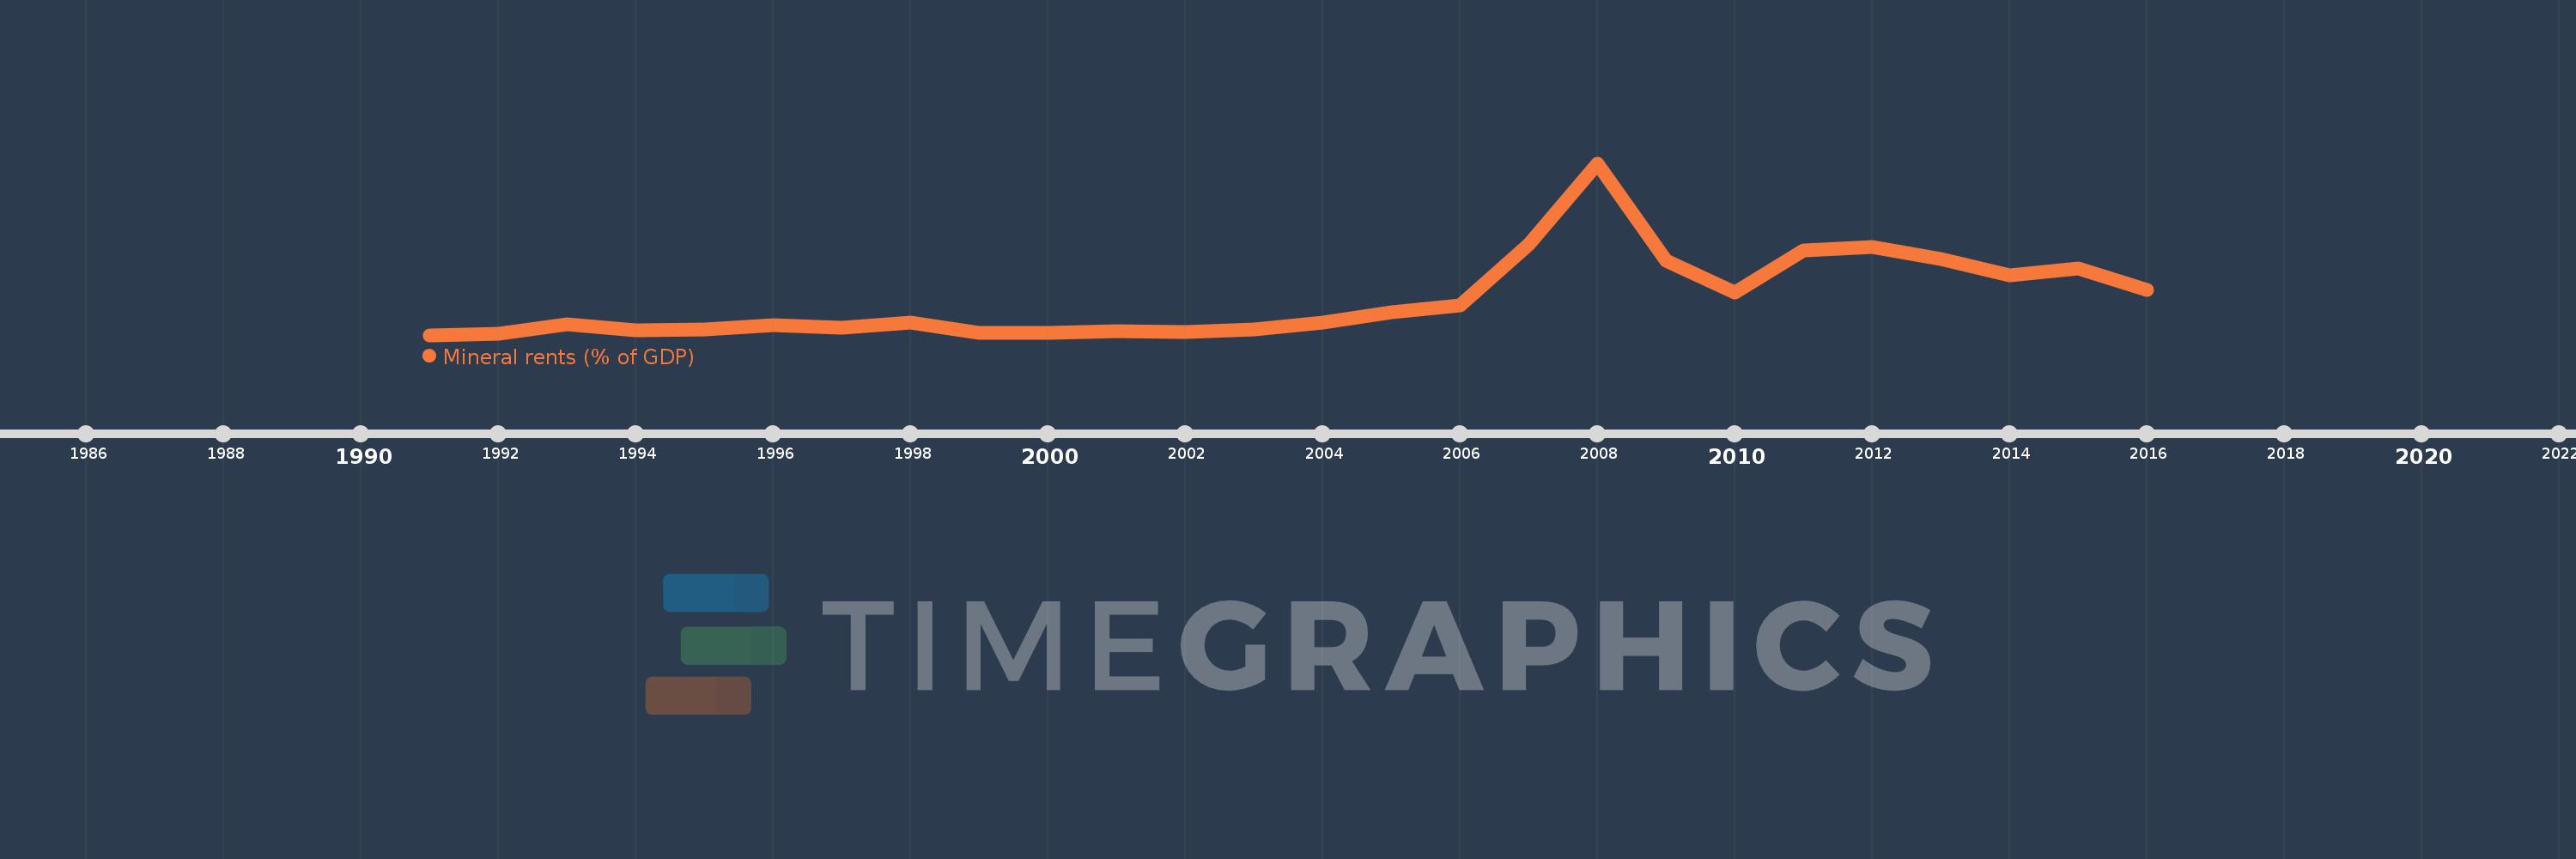
This timeline shows a graph from 1991 to 2016 of Macedonia, FYR. No data until 1990. Number of actual observations by date: 26.
Source name:
World Development Indicators
Source organization:
Estimates based on sources and methods described in "The Changing Wealth of Nations: Measuring Sustainable Development in the New Millennium" (World Bank, 2011).
Categories, topics:
Energy & Mining, Environment
Last updated:
apr 23, 2017
Indicators value changes by year
Meaning:
1.529
Minimum:
0.0
jan 1, 1991
Maximum:
7.315
jan 1, 2008
At the date of observation
Value
Absolute change
Change from the previous value
jan 1, 1991
0.0
0.0
0.0%
jan 1, 1992
0.057
+0.057
%
jan 1, 1993
0.448
+0.392
692.86%
jan 1, 1994
0.201
-0.247
-55.14%
jan 1, 1995
0.229
+0.027
13.65%
jan 1, 1996
0.408
+0.179
78.41%
jan 1, 1997
0.328
-0.08
-19.62%
jan 1, 1998
0.53
+0.202
61.58%
jan 1, 1999
0.082
-0.448
-84.55%
jan 1, 2000
0.104
+0.022
26.53%
jan 1, 2001
0.173
+0.07
67.13%
jan 1, 2002
0.12
-0.053
-30.79%
jan 1, 2003
0.244
+0.124
103.45%
jan 1, 2004
0.528
+0.285
116.88%
jan 1, 2005
0.98
+0.452
85.47%
jan 1, 2006
1.262
+0.282
28.78%
jan 1, 2007
3.859
+2.597
205.76%
jan 1, 2008
7.315
+3.456
89.55%
jan 1, 2009
3.171
-4.144
-56.65%
jan 1, 2010
1.807
-1.364
-43.03%
jan 1, 2011
3.612
+1.805
99.91%
jan 1, 2012
3.753
+0.142
3.92%
jan 1, 2013
3.252
-0.501
-13.35%
jan 1, 2014
2.549
-0.703
-21.61%
jan 1, 2015
2.832
+0.282
11.08%
jan 1, 2016
1.909
-0.922
-32.57%
Ranking of countries by current statistics by years