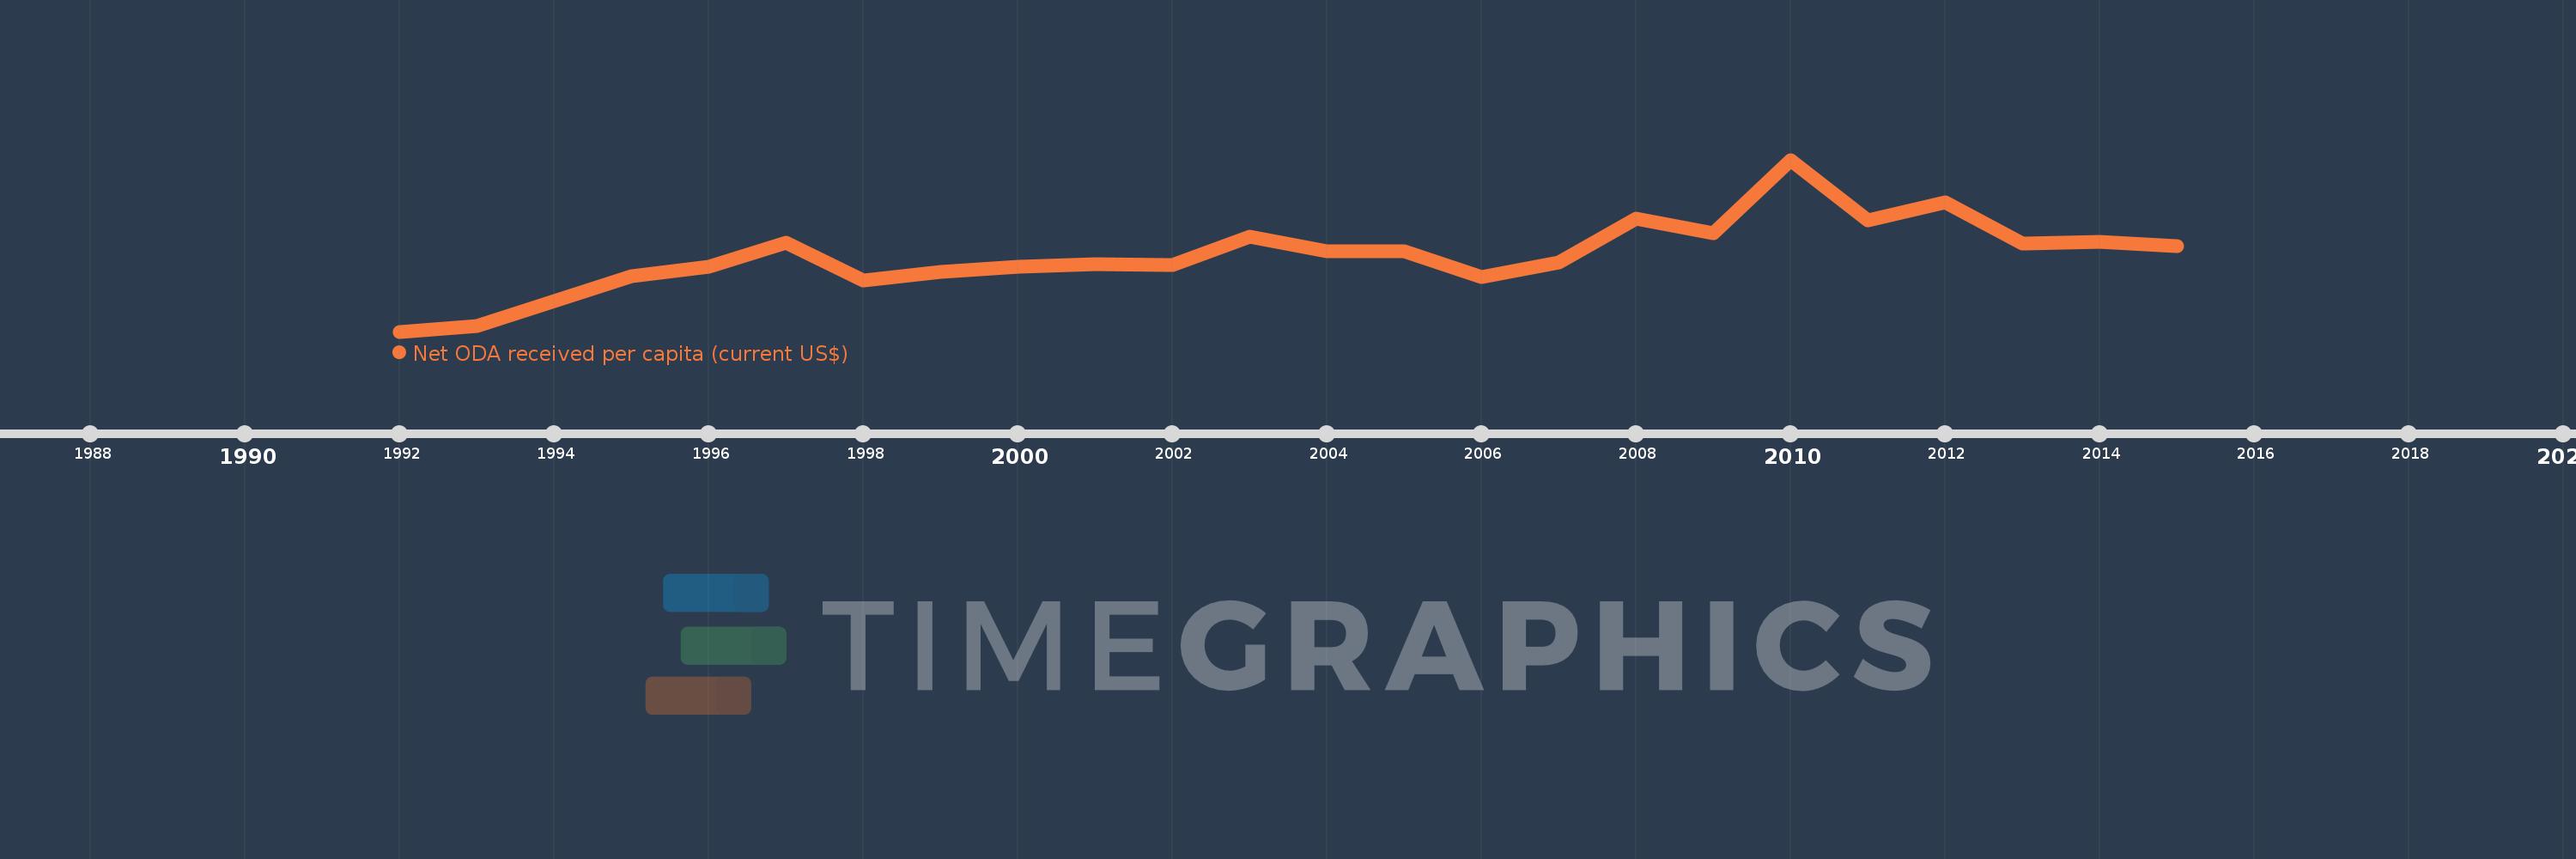
This timeline shows a graph from 1992 to 2015 of Armenia. No data until 1991. Number of actual observations by date: 24.
Source name:
World Development Indicators
Source organization:
Development Assistance Committee of the Organisation for Economic Co-operation and Development, Geographical Distribution of Financial Flows to Developing Countries, Development Co-operation Report, and International Development Statistics database. Data are available online at: www.oecd.org/dac/stats/idsonline. World Bank population estimates are used for the denominator.
Categories, topics:
Aid Effectiveness, Economy & Growth, External Debt
Last updated:
apr 23, 2017
Indicators value changes by year
Meaning:
78.819
Minimum:
0.775
jan 1, 1992
Maximum:
177.33
jan 1, 2010
At the date of observation
Value
Absolute change
Change from the previous value
jan 1, 1992
0.775
+0.775
0.0%
jan 1, 1993
6.508
+5.734
740.3%
jan 1, 1994
32.484
+25.976
399.12%
jan 1, 1995
58.138
+25.654
78.97%
jan 1, 1996
67.508
+9.37
16.12%
jan 1, 1997
92.065
+24.557
36.38%
jan 1, 1998
52.938
-39.127
-42.5%
jan 1, 1999
62.384
+9.447
17.84%
jan 1, 2000
67.612
+5.228
8.38%
jan 1, 2001
70.183
+2.571
3.8%
jan 1, 2002
69.159
-1.024
-1.46%
jan 1, 2003
98.315
+29.156
42.16%
jan 1, 2004
83.585
-14.73
-14.98%
jan 1, 2005
83.745
+0.159
0.19%
jan 1, 2006
56.499
-27.246
-32.53%
jan 1, 2007
71.785
+15.286
27.06%
jan 1, 2008
117.137
+45.352
63.18%
jan 1, 2009
101.727
-15.411
-13.16%
jan 1, 2010
177.33
+75.603
74.32%
jan 1, 2011
115.495
-61.835
-34.87%
jan 1, 2012
133.741
+18.245
15.8%
jan 1, 2013
91.044
-42.697
-31.92%
jan 1, 2014
93.229
+2.185
2.4%
jan 1, 2015
88.266
-4.964
-5.32%
Ranking of countries by current statistics by years