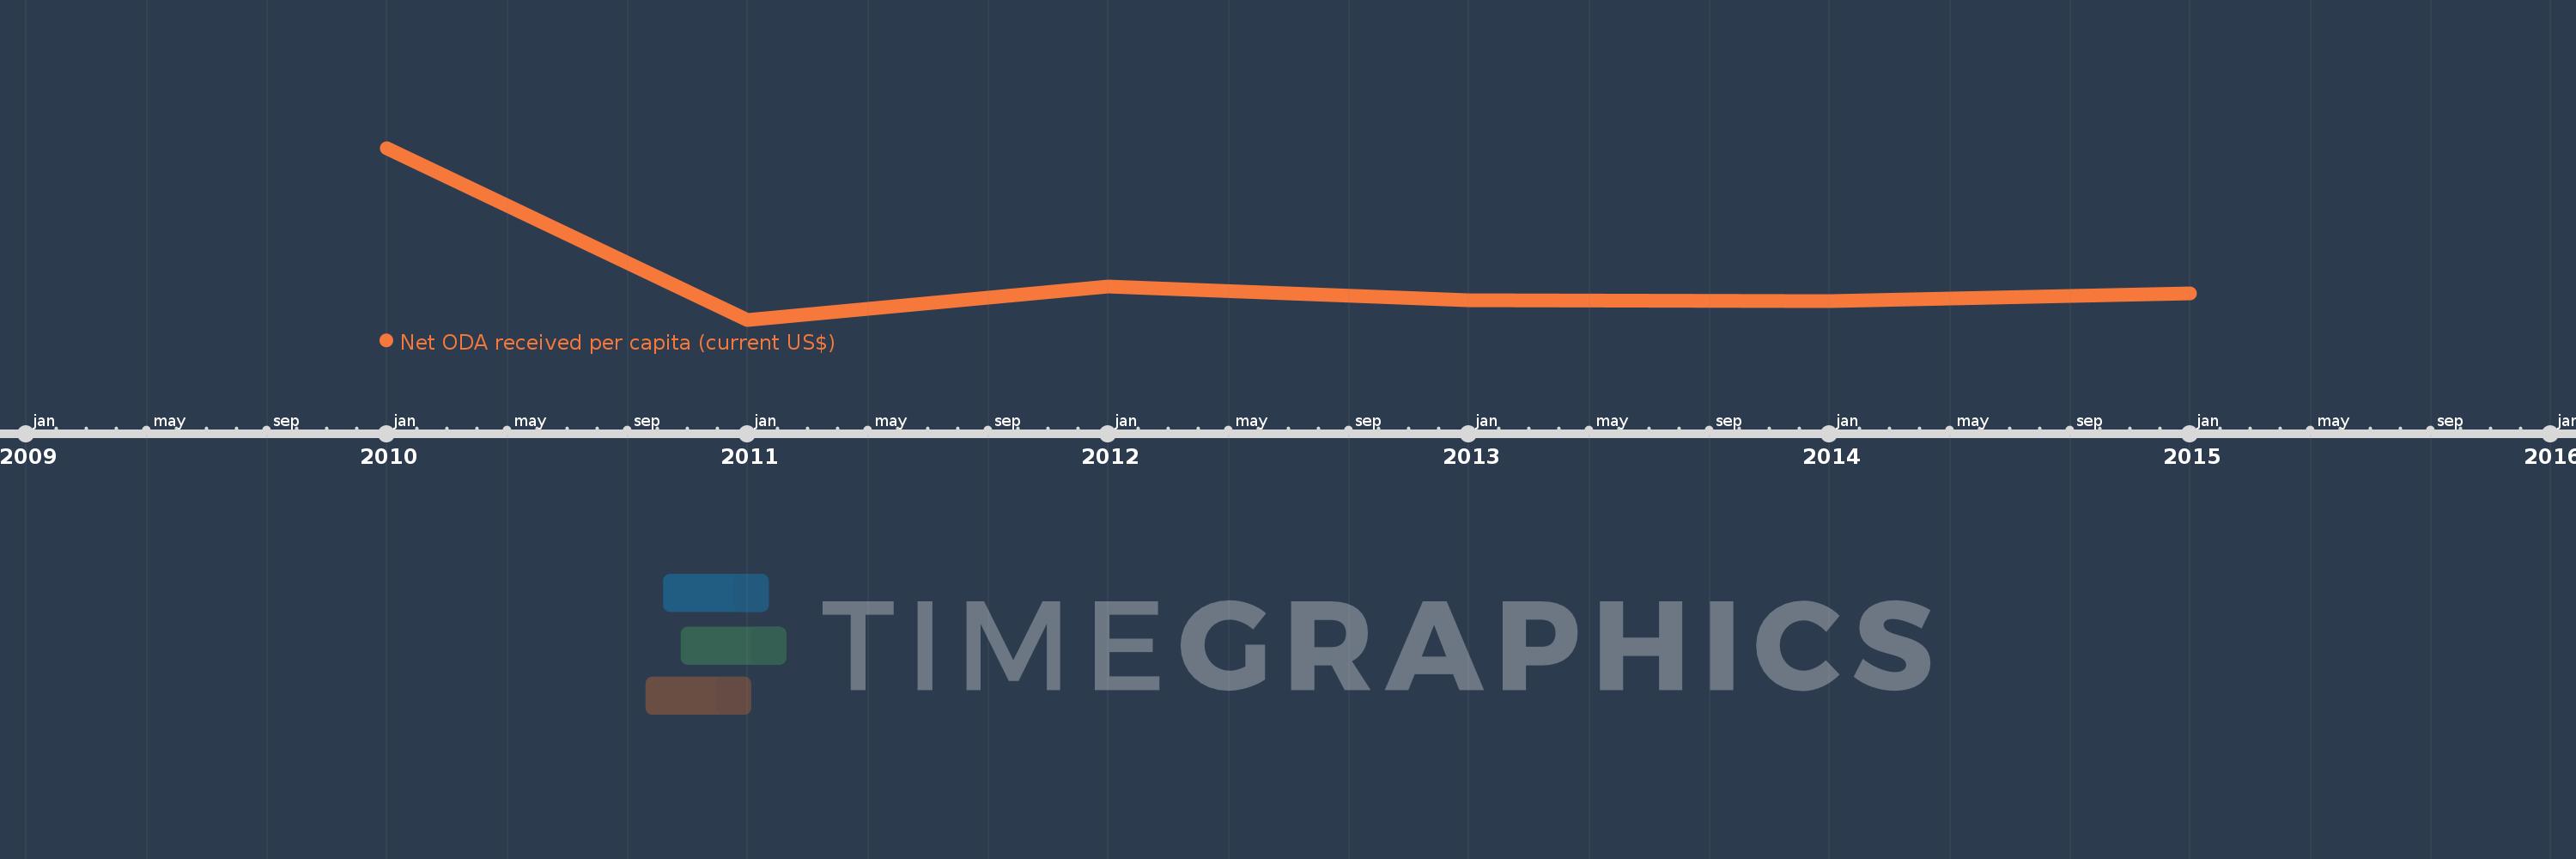
This timeline shows a graph from 2010 to 2015 of Kosovo. No data until 2009. Number of actual observations by date: 6.
Source name:
World Development Indicators
Source organization:
Development Assistance Committee of the Organisation for Economic Co-operation and Development, Geographical Distribution of Financial Flows to Developing Countries, Development Co-operation Report, and International Development Statistics database. Data are available online at: www.oecd.org/dac/stats/idsonline. World Bank population estimates are used for the denominator.
Categories, topics:
Aid Effectiveness, Economy & Growth, External Debt
Last updated:
apr 23, 2017
Indicators value changes by year
Meaning:
335.513
Minimum:
297.081
jan 1, 2011
Maximum:
444.02
jan 1, 2010
At the date of observation
Value
Absolute change
Change from the previous value
jan 1, 2010
444.02
+444.02
0.0%
jan 1, 2011
297.081
-146.94
-33.09%
jan 1, 2012
325.625
+28.544
9.61%
jan 1, 2013
313.949
-11.676
-3.59%
jan 1, 2014
312.714
-1.235
-0.39%
jan 1, 2015
319.687
+6.974
2.23%
Ranking of countries by current statistics by years