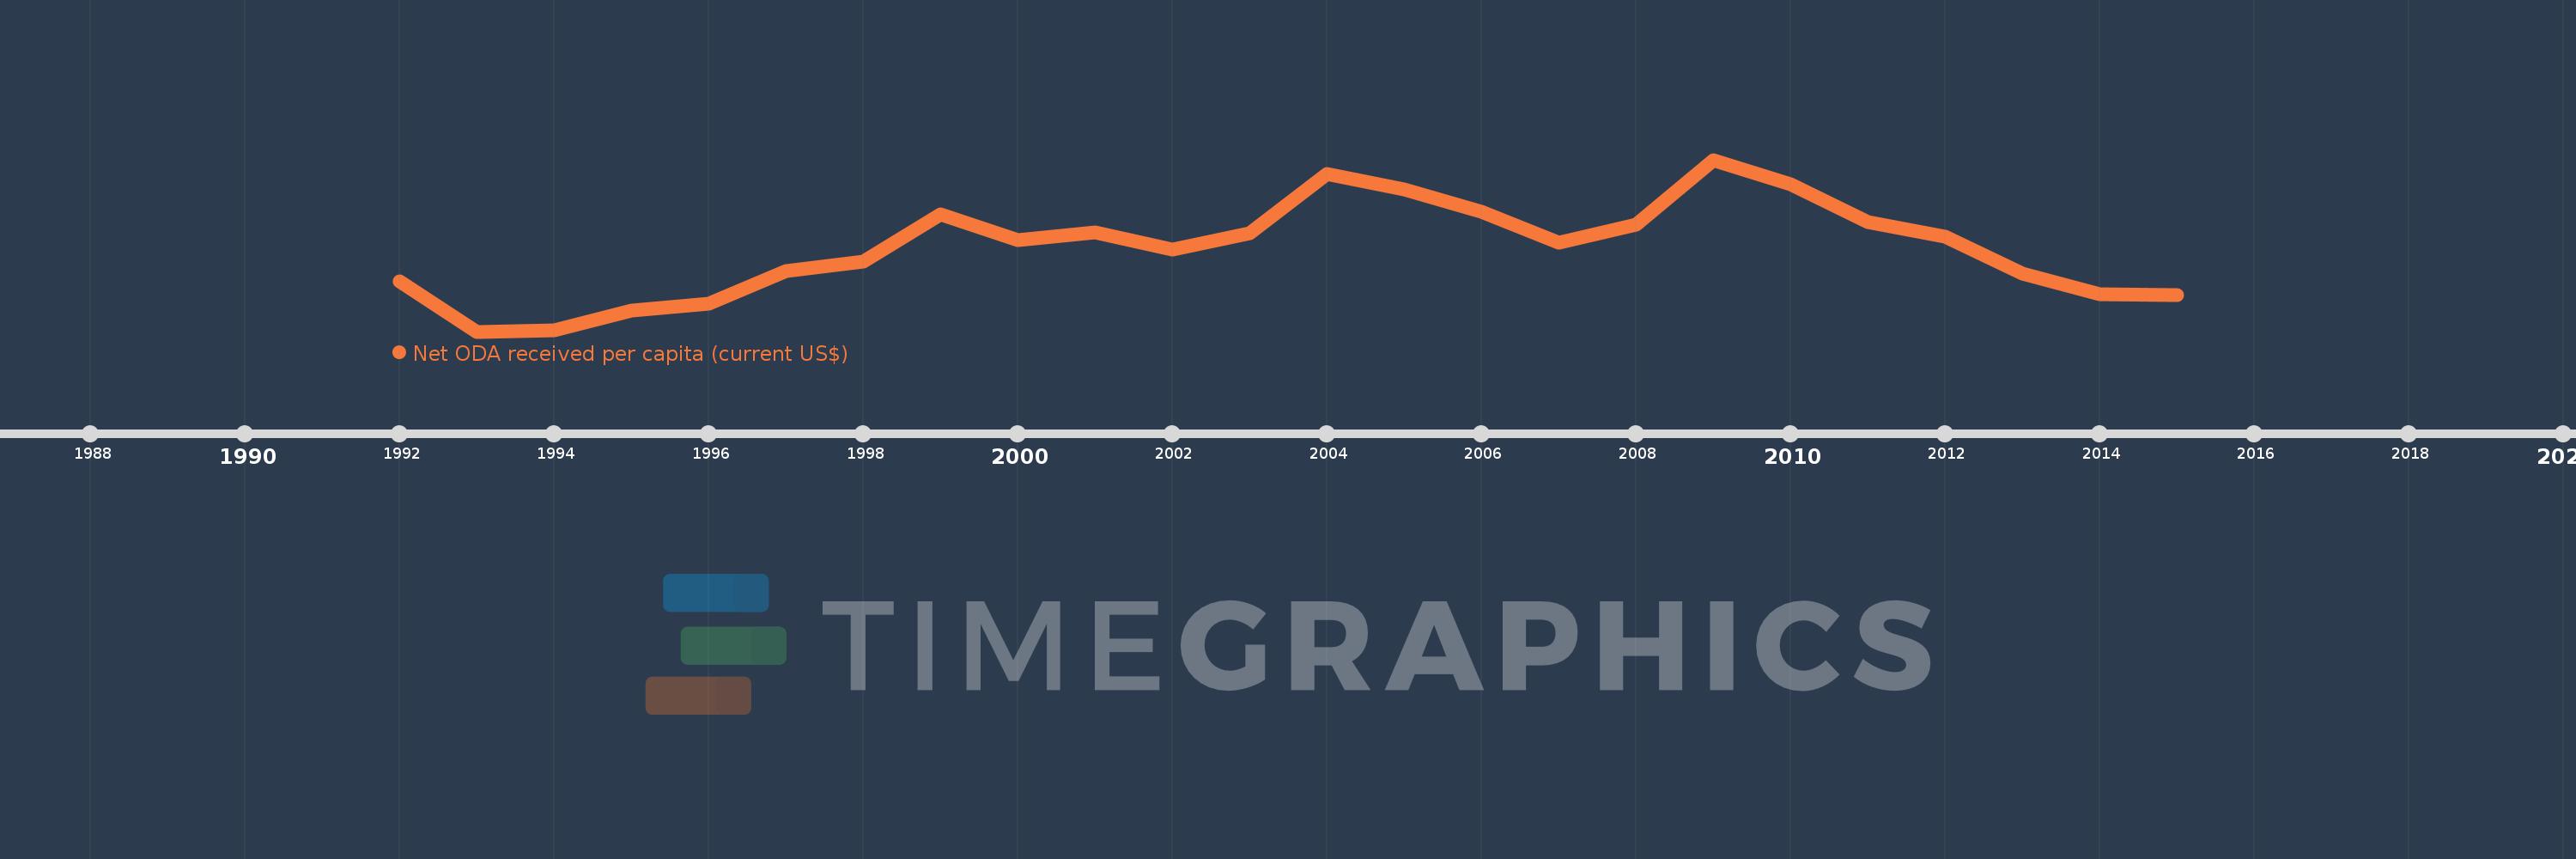
This timeline shows a graph from 1992 to 2015 of Kazakhstan. No data until 1991. Number of actual observations by date: 24.
Source name:
World Development Indicators
Source organization:
Development Assistance Committee of the Organisation for Economic Co-operation and Development, Geographical Distribution of Financial Flows to Developing Countries, Development Co-operation Report, and International Development Statistics database. Data are available online at: www.oecd.org/dac/stats/idsonline. World Bank population estimates are used for the denominator.
Categories, topics:
Aid Effectiveness, Economy & Growth, External Debt
Last updated:
apr 23, 2017
Indicators value changes by year
Meaning:
10.709
Minimum:
0.734
jan 1, 1993
Maximum:
21.399
jan 1, 2009
At the date of observation
Value
Absolute change
Change from the previous value
jan 1, 1992
6.778
+6.778
0.0%
jan 1, 1993
0.734
-6.044
-89.17%
jan 1, 1994
0.94
+0.206
28.02%
jan 1, 1995
3.31
+2.37
252.11%
jan 1, 1996
4.099
+0.789
23.85%
jan 1, 1997
7.989
+3.89
94.89%
jan 1, 1998
9.205
+1.216
15.23%
jan 1, 1999
14.814
+5.608
60.93%
jan 1, 2000
11.721
-3.092
-20.87%
jan 1, 2001
12.711
+0.99
8.45%
jan 1, 2002
10.566
-2.145
-16.87%
jan 1, 2003
12.613
+2.047
19.37%
jan 1, 2004
19.71
+7.097
56.27%
jan 1, 2005
17.835
-1.875
-9.51%
jan 1, 2006
15.111
-2.725
-15.28%
jan 1, 2007
11.386
-3.724
-24.65%
jan 1, 2008
13.615
+2.229
19.58%
jan 1, 2009
21.399
+7.784
57.17%
jan 1, 2010
18.488
-2.911
-13.6%
jan 1, 2011
13.87
-4.618
-24.98%
jan 1, 2012
12.166
-1.704
-12.28%
jan 1, 2013
7.662
-4.504
-37.02%
jan 1, 2014
5.178
-2.484
-32.42%
jan 1, 2015
5.115
-0.063
-1.22%
Ranking of countries by current statistics by years