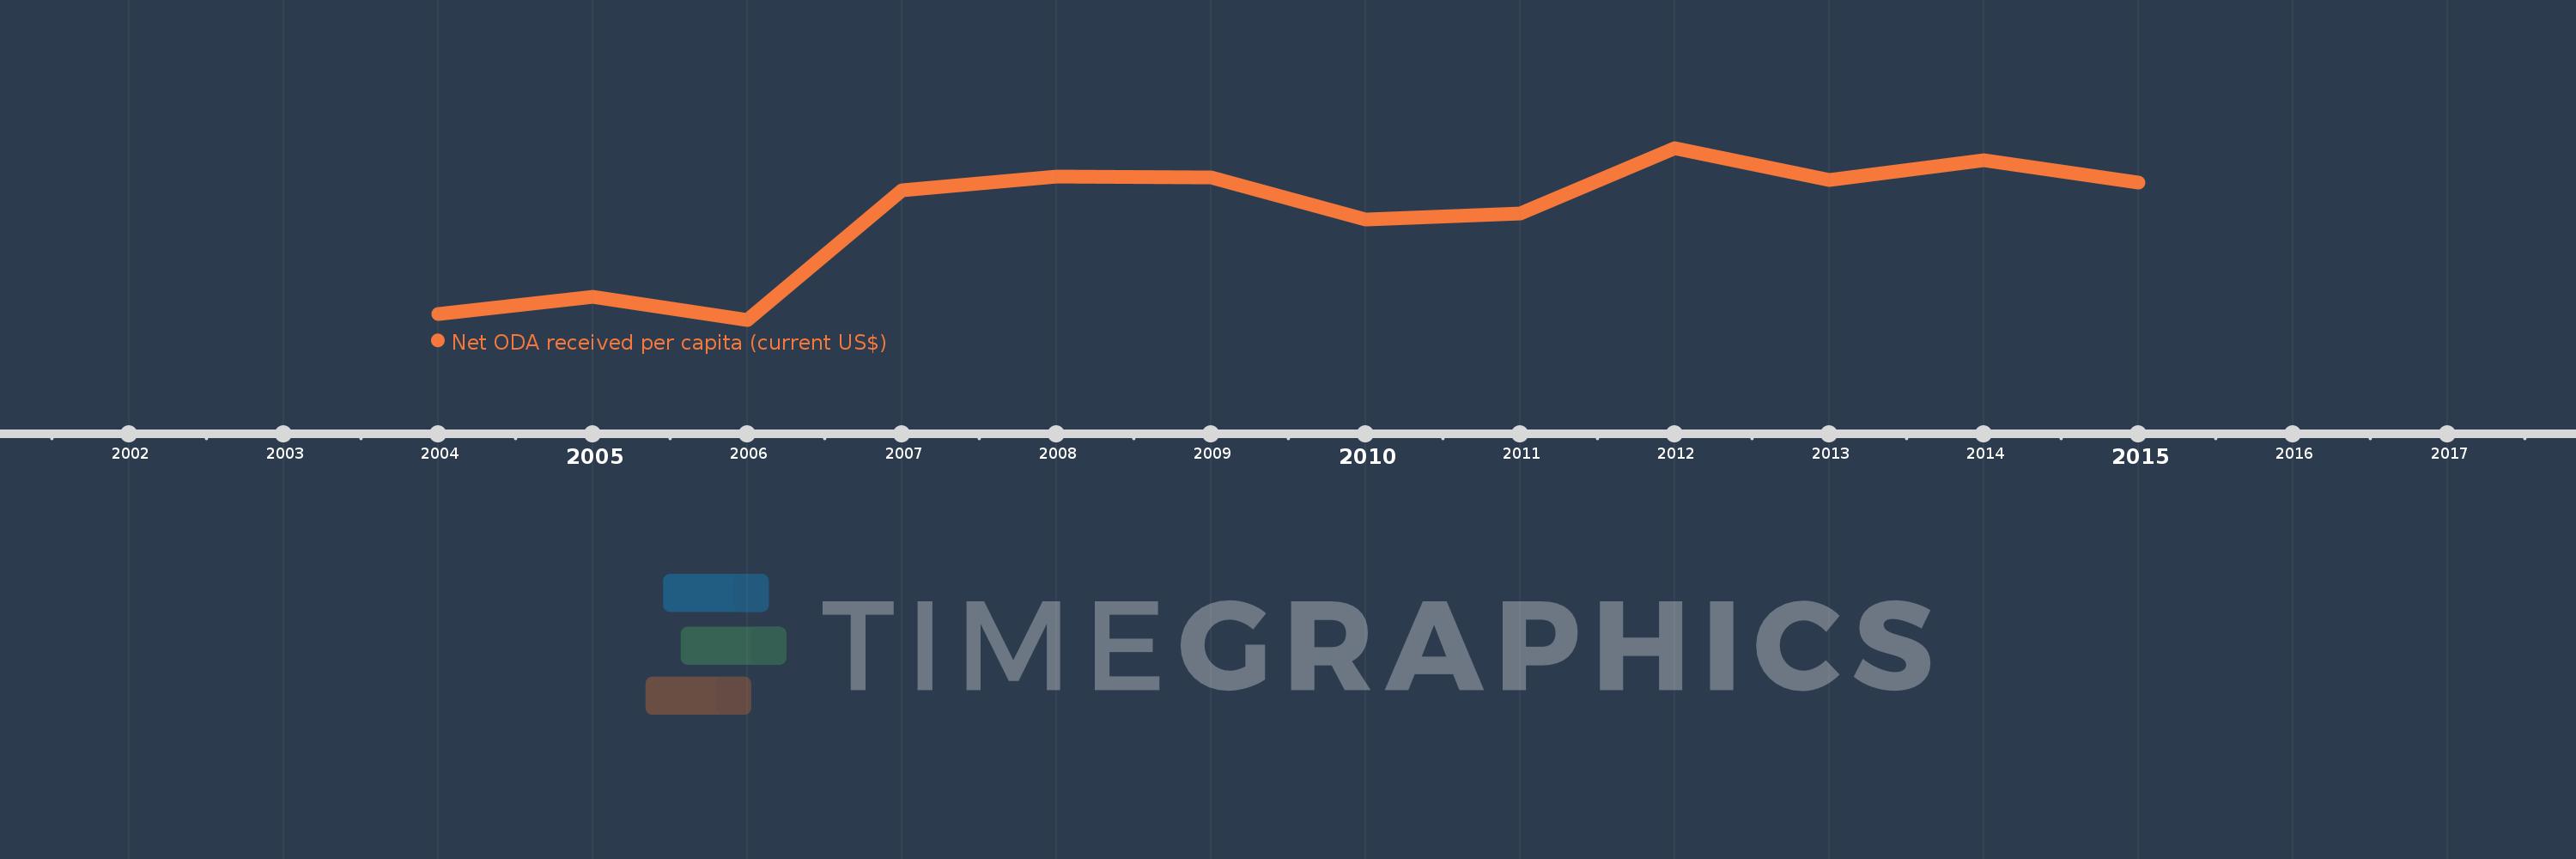
This timeline shows a graph from 2004 to 2015 of Montenegro. No data until 2003. Number of actual observations by date: 12.
Source name:
World Development Indicators
Source organization:
Development Assistance Committee of the Organisation for Economic Co-operation and Development, Geographical Distribution of Financial Flows to Developing Countries, Development Co-operation Report, and International Development Statistics database. Data are available online at: www.oecd.org/dac/stats/idsonline. World Bank population estimates are used for the denominator.
Categories, topics:
Aid Effectiveness, Economy & Growth, External Debt
Last updated:
apr 23, 2017
Indicators value changes by year
Meaning:
127.028
Minimum:
6.284
jan 1, 2006
Maximum:
204.232
jan 1, 2012
At the date of observation
Value
Absolute change
Change from the previous value
jan 1, 2004
13.295
+13.295
0.0%
jan 1, 2005
32.82
+19.525
146.86%
jan 1, 2006
6.284
-26.536
-80.85%
jan 1, 2007
155.425
+149.141
2.37K%
jan 1, 2008
171.545
+16.12
10.37%
jan 1, 2009
169.96
-1.585
-0.92%
jan 1, 2010
121.35
-48.61
-28.6%
jan 1, 2011
128.473
+7.123
5.87%
jan 1, 2012
204.232
+75.759
58.97%
jan 1, 2013
167.161
-37.071
-18.15%
jan 1, 2014
189.921
+22.76
13.62%
jan 1, 2015
163.876
-26.044
-13.71%
Ranking of countries by current statistics by years