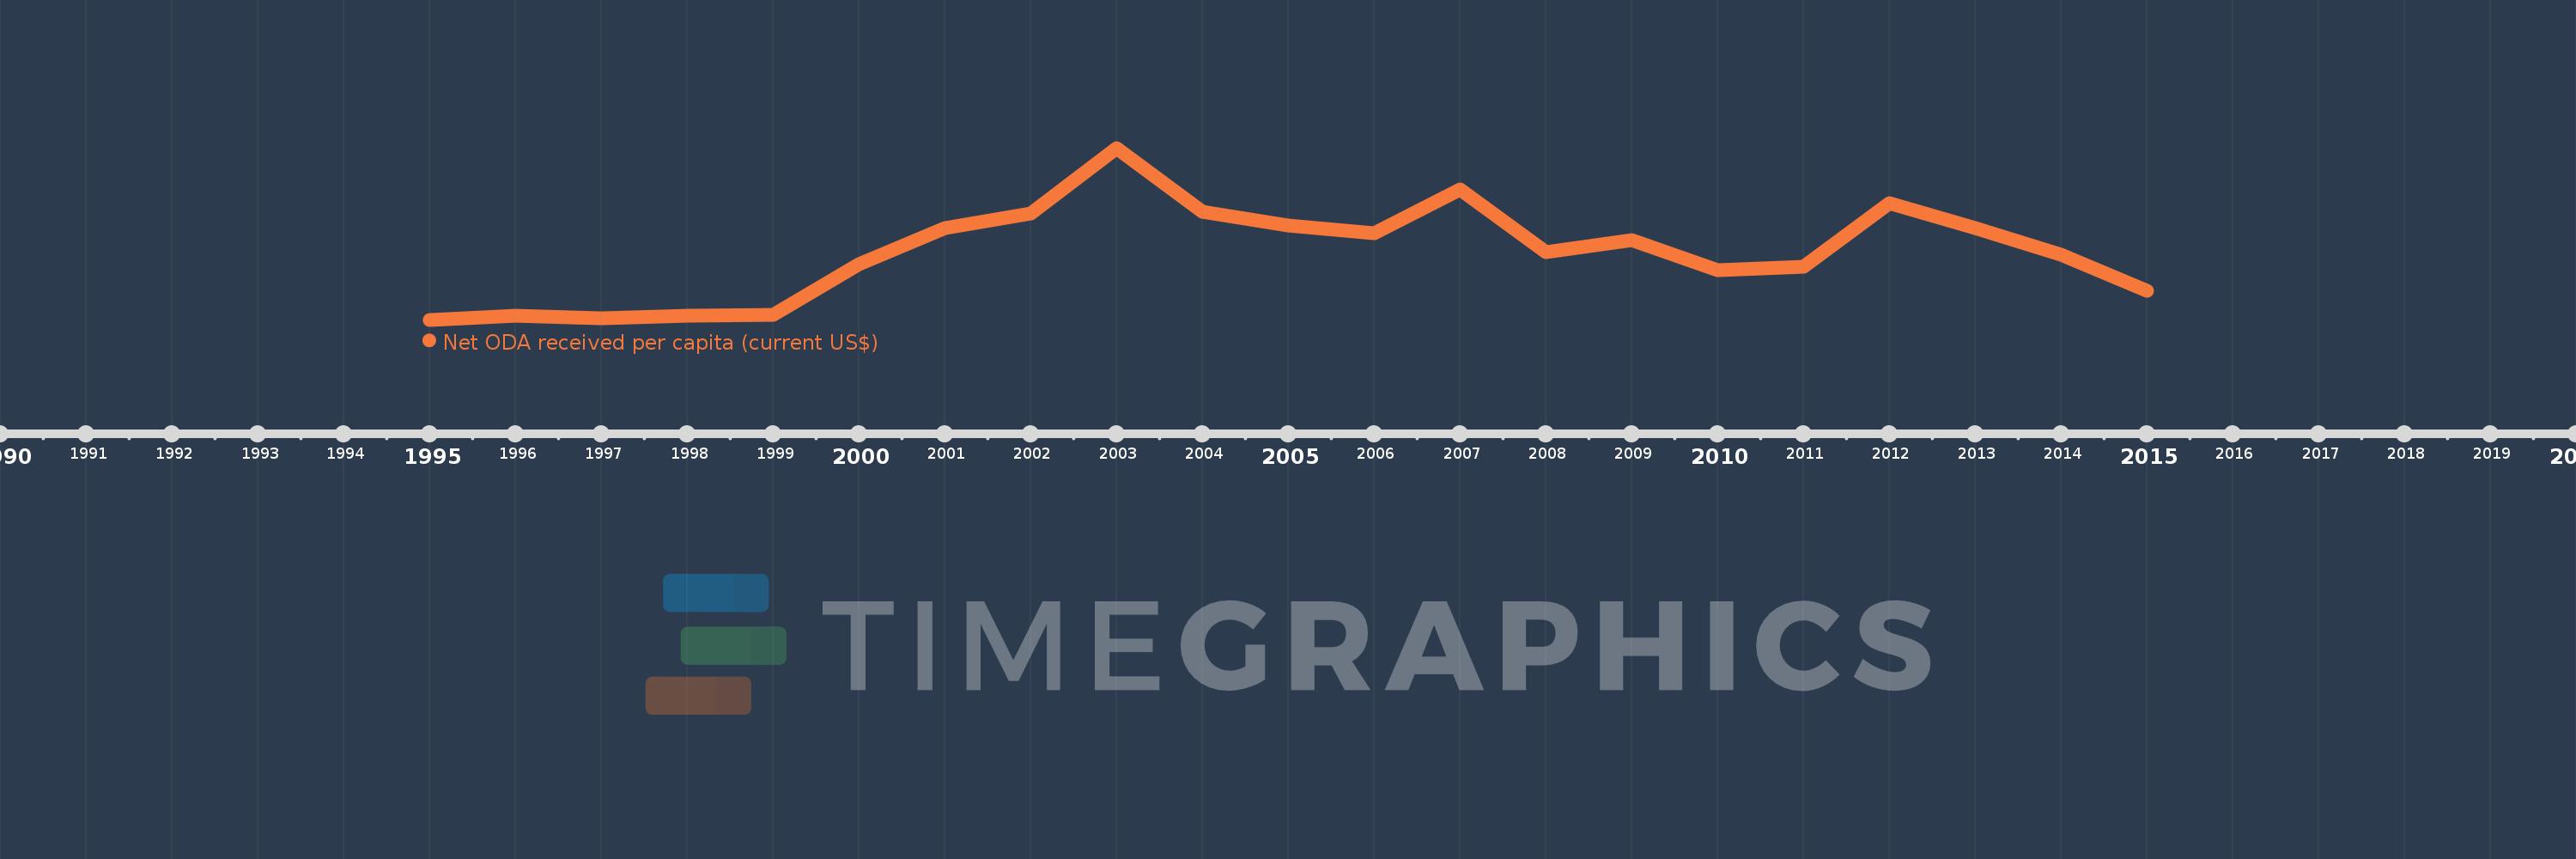
This timeline shows a graph from 1995 to 2015 of Serbia. No data until 1994. Number of actual observations by date: 21.
Source name:
World Development Indicators
Source organization:
Development Assistance Committee of the Organisation for Economic Co-operation and Development, Geographical Distribution of Financial Flows to Developing Countries, Development Co-operation Report, and International Development Statistics database. Data are available online at: www.oecd.org/dac/stats/idsonline. World Bank population estimates are used for the denominator.
Categories, topics:
Aid Effectiveness, Economy & Growth, External Debt
Last updated:
apr 23, 2017
Indicators value changes by year
Meaning:
112.587
Minimum:
6.364
jan 1, 1995
Maximum:
278.081
jan 1, 2003
At the date of observation
Value
Absolute change
Change from the previous value
jan 1, 1995
6.364
+6.364
0.0%
jan 1, 1996
12.466
+6.103
95.9%
jan 1, 1997
9.125
-3.342
-26.81%
jan 1, 1998
12.816
+3.692
40.46%
jan 1, 1999
14.301
+1.485
11.59%
jan 1, 2000
93.815
+79.513
555.98%
jan 1, 2001
150.907
+57.092
60.86%
jan 1, 2002
173.811
+22.904
15.18%
jan 1, 2003
278.081
+104.27
59.99%
jan 1, 2004
176.481
-101.6
-36.54%
jan 1, 2005
155.123
-21.357
-12.1%
jan 1, 2006
143.313
-11.81
-7.61%
jan 1, 2007
212.859
+69.546
48.53%
jan 1, 2008
113.791
-99.068
-46.54%
jan 1, 2009
132.401
+18.61
16.35%
jan 1, 2010
85.196
-47.206
-35.65%
jan 1, 2011
90.506
+5.311
6.23%
jan 1, 2012
190.733
+100.227
110.74%
jan 1, 2013
151.281
-39.452
-20.68%
jan 1, 2014
108.923
-42.357
-28.0%
jan 1, 2015
52.036
-56.887
-52.23%
Ranking of countries by current statistics by years