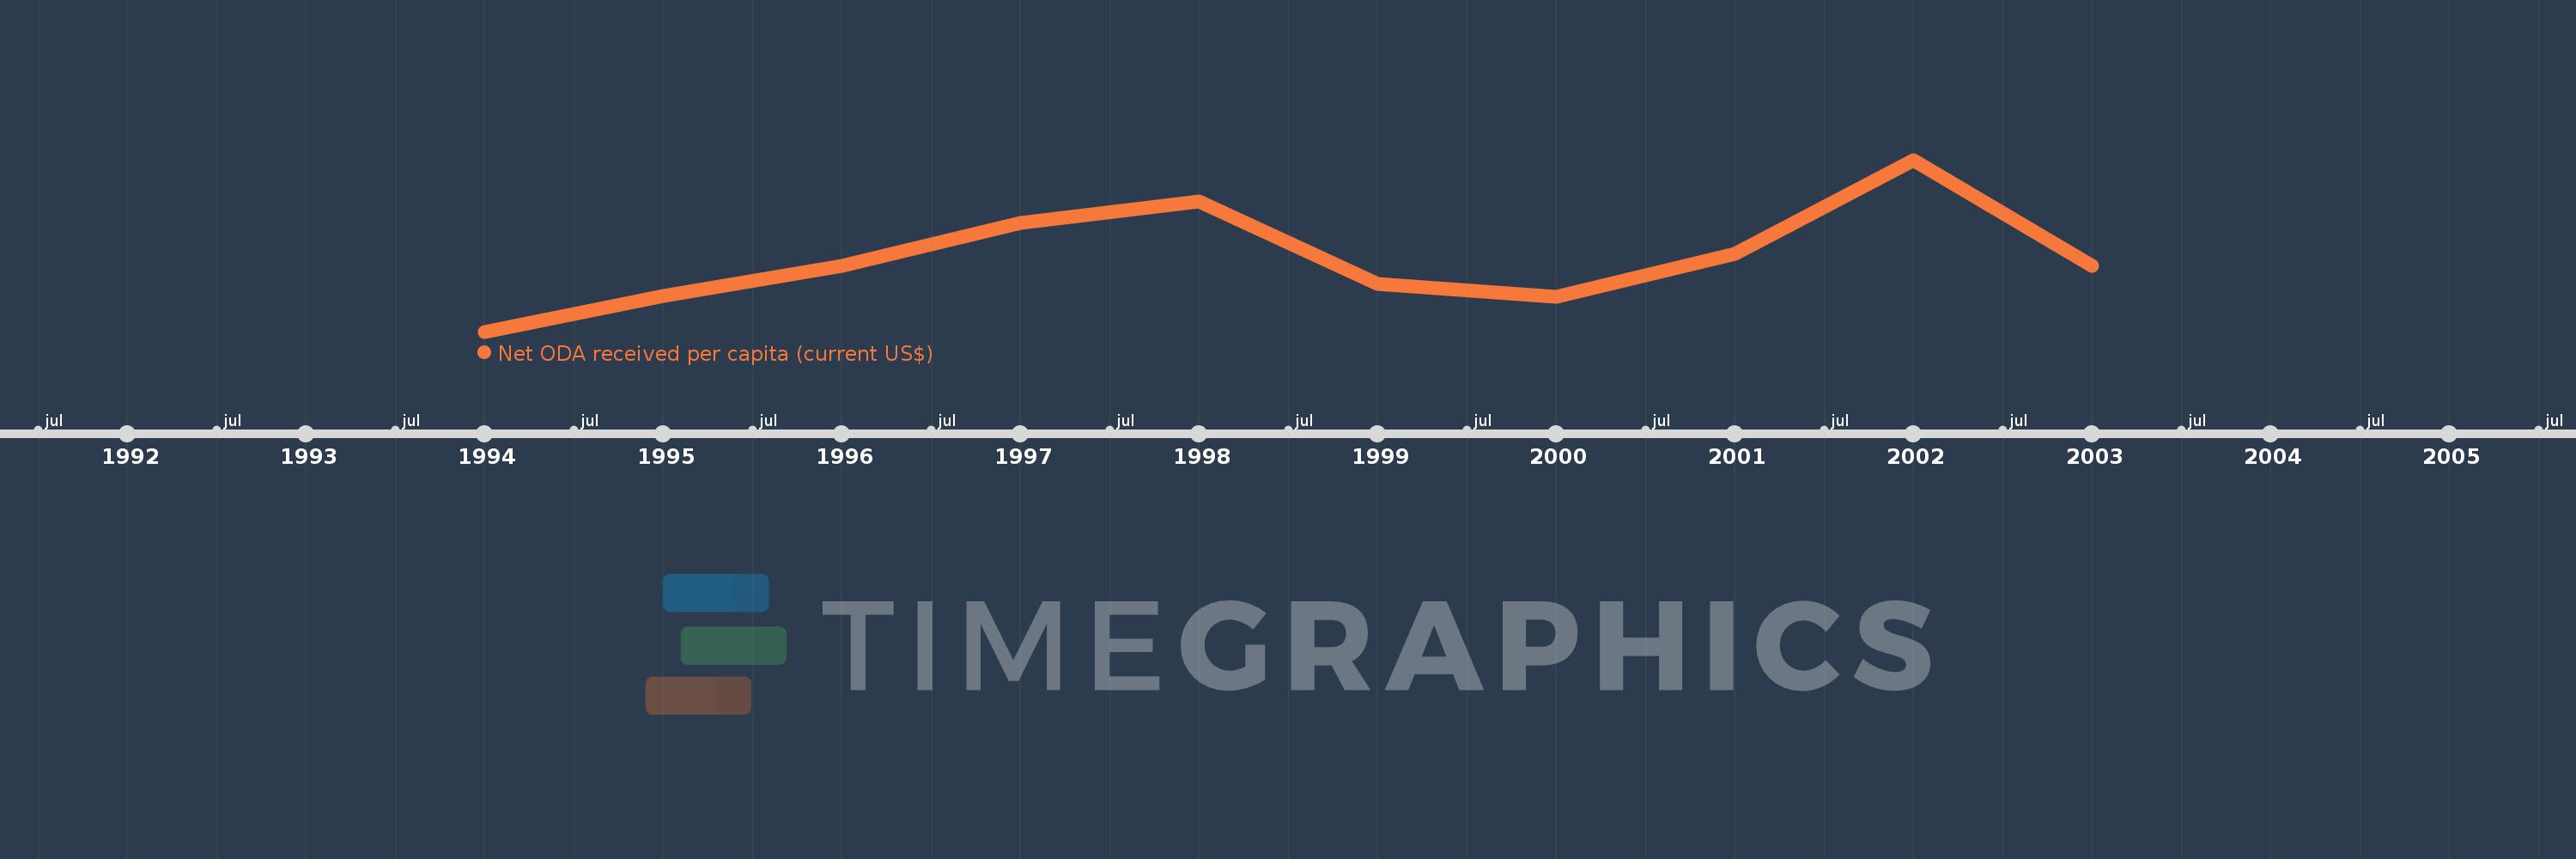
This timeline shows a graph from 1994 to 2003 of Slovenia. No data until 1993. Number of actual observations by date: 10.
Source name:
World Development Indicators
Source organization:
Development Assistance Committee of the Organisation for Economic Co-operation and Development, Geographical Distribution of Financial Flows to Developing Countries, Development Co-operation Report, and International Development Statistics database. Data are available online at: www.oecd.org/dac/stats/idsonline. World Bank population estimates are used for the denominator.
Categories, topics:
Aid Effectiveness, Economy & Growth, External Debt
Last updated:
apr 23, 2017
Indicators value changes by year
Meaning:
29.182
Minimum:
3.585
jan 1, 1994
Maximum:
63.08
jan 1, 2002
At the date of observation
Value
Absolute change
Change from the previous value
jan 1, 1994
3.585
+3.585
0.0%
jan 1, 1995
16.02
+12.435
346.88%
jan 1, 1996
26.404
+10.384
64.82%
jan 1, 1997
41.335
+14.931
56.55%
jan 1, 1998
48.652
+7.317
17.7%
jan 1, 1999
20.064
-28.587
-58.76%
jan 1, 2000
15.658
-4.407
-21.96%
jan 1, 2001
30.574
+14.917
95.27%
jan 1, 2002
63.08
+32.506
106.32%
jan 1, 2003
26.452
-36.628
-58.07%
Ranking of countries by current statistics by years