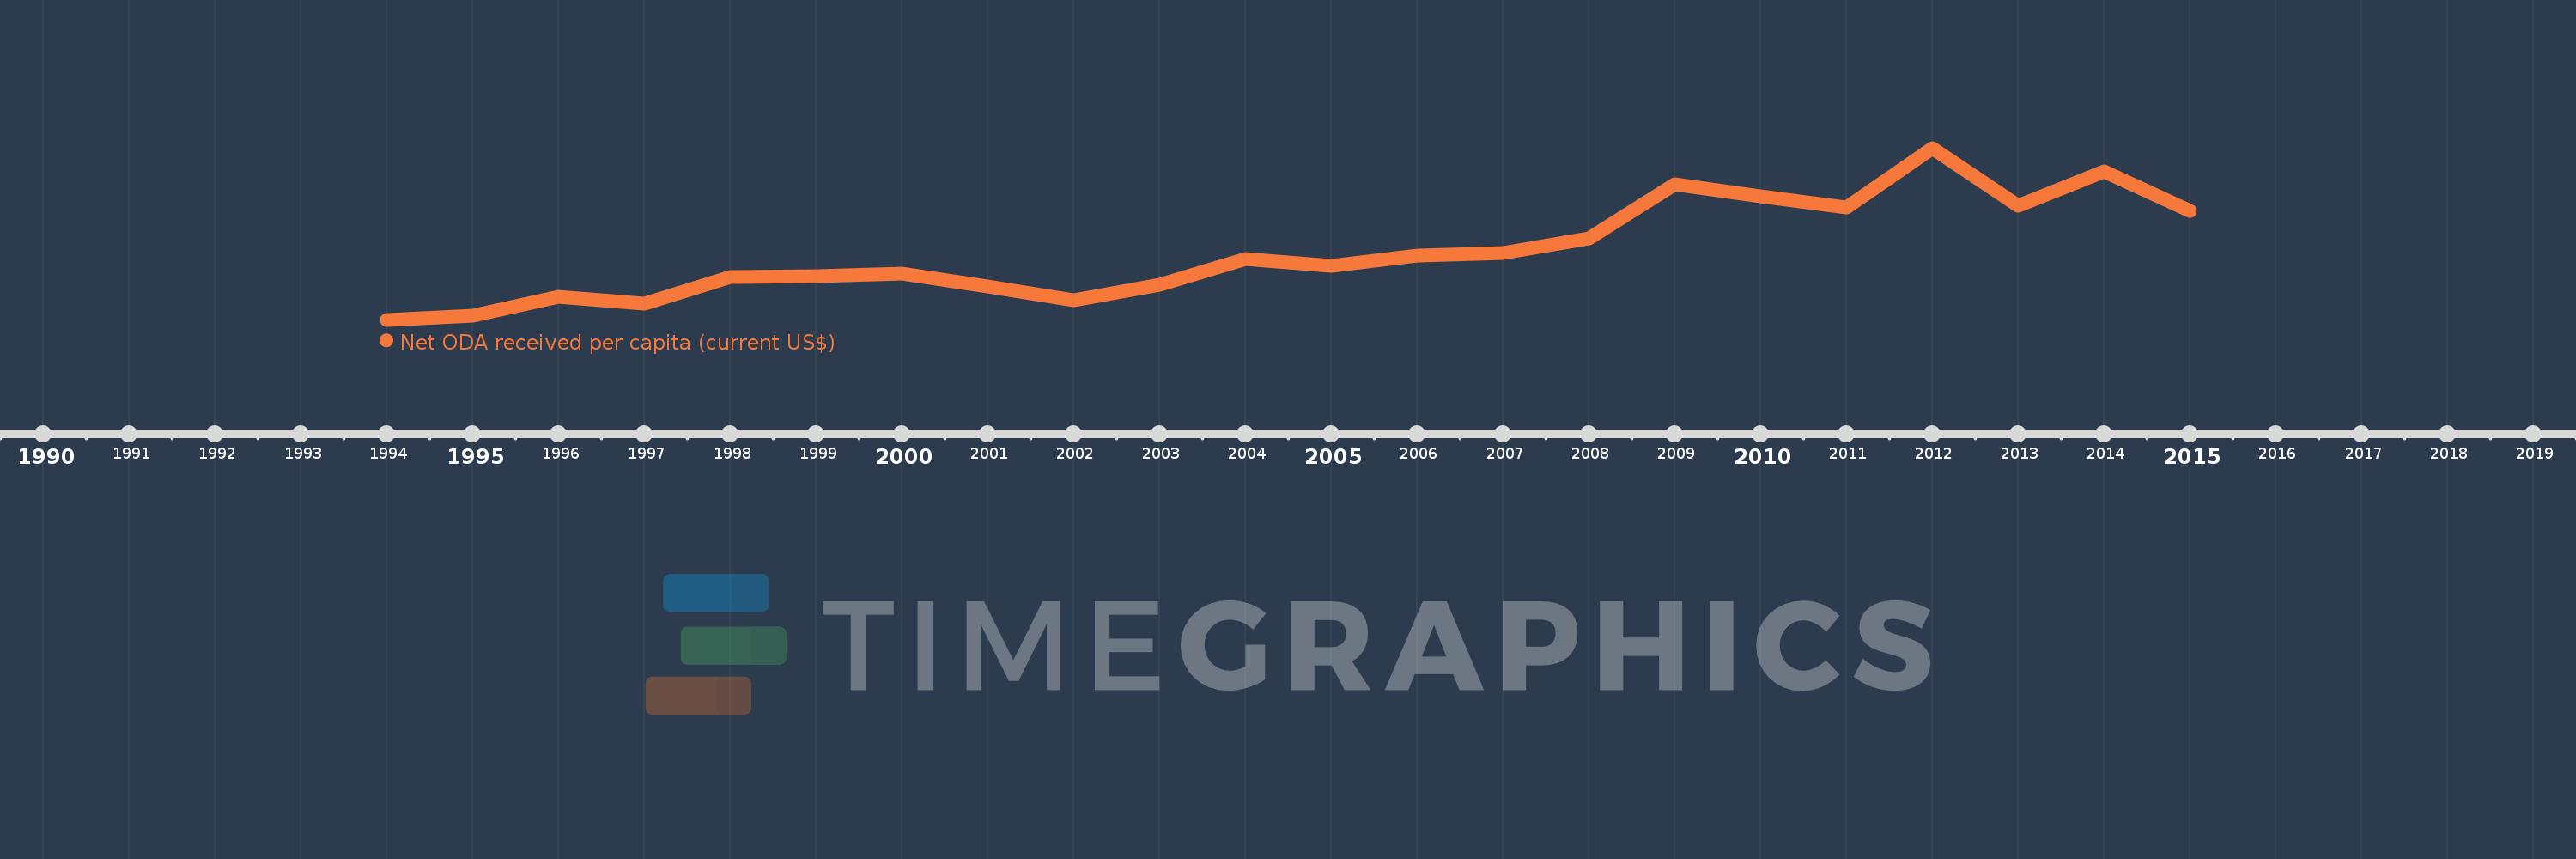
This timeline shows a graph from 1994 to 2015 of South Africa. No data until 1993. Number of actual observations by date: 22.
Source name:
World Development Indicators
Source organization:
Development Assistance Committee of the Organisation for Economic Co-operation and Development, Geographical Distribution of Financial Flows to Developing Countries, Development Co-operation Report, and International Development Statistics database. Data are available online at: www.oecd.org/dac/stats/idsonline. World Bank population estimates are used for the denominator.
Categories, topics:
Aid Effectiveness, Economy & Growth, External Debt
Last updated:
apr 23, 2017
Indicators value changes by year
Meaning:
15.114
Minimum:
7.217
jan 1, 1994
Maximum:
27.068
jan 1, 2012
At the date of observation
Value
Absolute change
Change from the previous value
jan 1, 1994
7.217
+7.217
0.0%
jan 1, 1995
7.656
+0.439
6.08%
jan 1, 1996
9.871
+2.216
28.94%
jan 1, 1997
9.058
-0.813
-8.24%
jan 1, 1998
12.109
+3.051
33.68%
jan 1, 1999
12.243
+0.134
1.1%
jan 1, 2000
12.591
+0.348
2.84%
jan 1, 2001
11.054
-1.537
-12.21%
jan 1, 2002
9.471
-1.583
-14.32%
jan 1, 2003
11.249
+1.778
18.77%
jan 1, 2004
14.243
+2.995
26.62%
jan 1, 2005
13.488
-0.755
-5.3%
jan 1, 2006
14.601
+1.113
8.25%
jan 1, 2007
14.92
+0.319
2.18%
jan 1, 2008
16.616
+1.696
11.37%
jan 1, 2009
22.825
+6.209
37.37%
jan 1, 2010
21.482
-1.343
-5.88%
jan 1, 2011
20.221
-1.26
-5.87%
jan 1, 2012
27.068
+6.847
33.86%
jan 1, 2013
20.359
-6.709
-24.78%
jan 1, 2014
24.354
+3.995
19.62%
jan 1, 2015
19.801
-4.552
-18.69%
Ranking of countries by current statistics by years