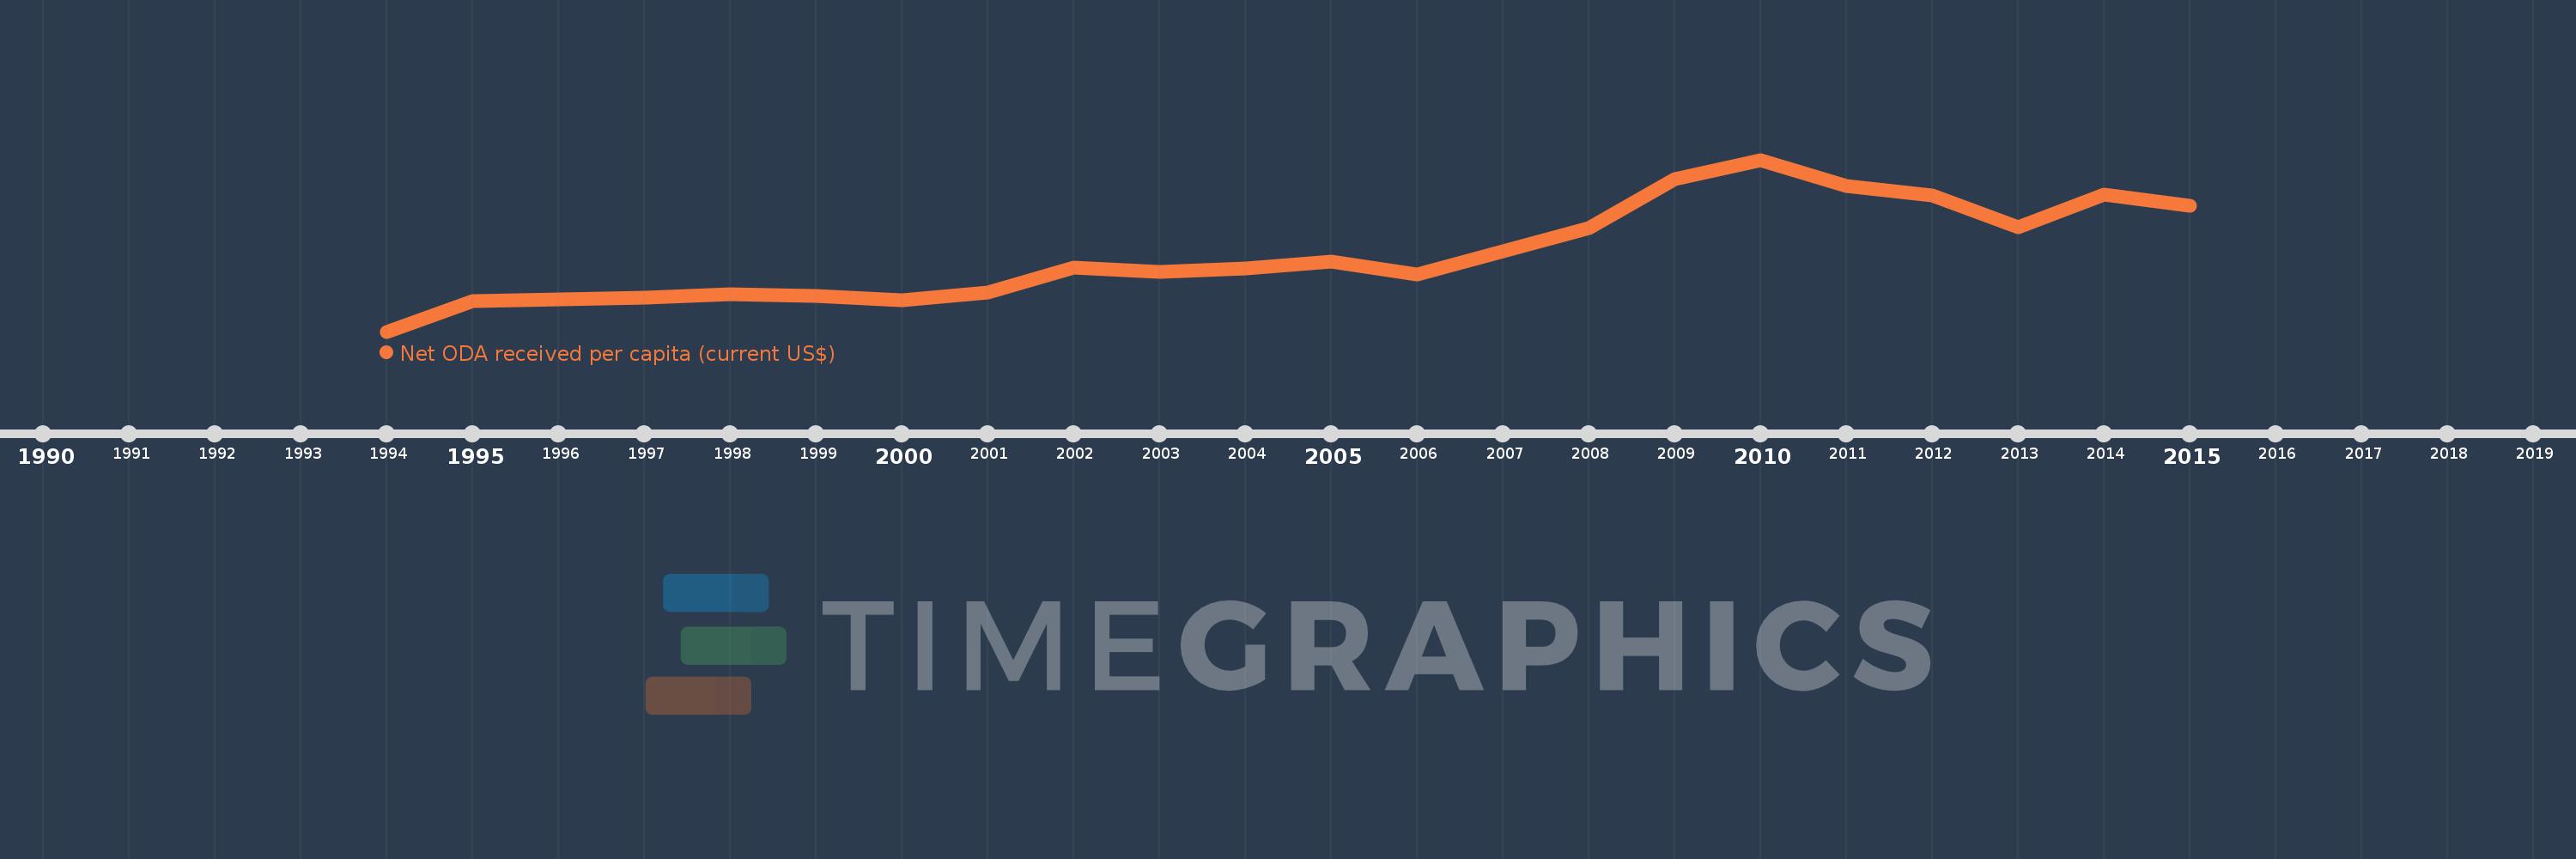
This timeline shows a graph from 1994 to 2015 of West Bank and Gaza. No data until 1993. Number of actual observations by date: 22.
Source name:
World Development Indicators
Source organization:
Development Assistance Committee of the Organisation for Economic Co-operation and Development, Geographical Distribution of Financial Flows to Developing Countries, Development Co-operation Report, and International Development Statistics database. Data are available online at: www.oecd.org/dac/stats/idsonline. World Bank population estimates are used for the denominator.
Categories, topics:
Aid Effectiveness, Economy & Growth, External Debt
Last updated:
apr 23, 2017
Indicators value changes by year
Meaning:
388.498
Minimum:
78.995
jan 1, 1994
Maximum:
763.51
jan 1, 2010
At the date of observation
Value
Absolute change
Change from the previous value
jan 1, 1994
78.995
+78.995
0.0%
jan 1, 1995
199.459
+120.464
152.5%
jan 1, 1996
207.749
+8.29
4.16%
jan 1, 1997
213.451
+5.702
2.74%
jan 1, 1998
226.501
+13.051
6.11%
jan 1, 1999
220.621
-5.88
-2.6%
jan 1, 2000
203.814
-16.807
-7.62%
jan 1, 2001
234.245
+30.431
14.93%
jan 1, 2002
332.776
+98.531
42.06%
jan 1, 2003
315.932
-16.843
-5.06%
jan 1, 2004
330.222
+14.29
4.52%
jan 1, 2005
358.657
+28.435
8.61%
jan 1, 2006
305.9
-52.757
-14.71%
jan 1, 2007
399.33
+93.429
30.54%
jan 1, 2008
491.376
+92.046
23.05%
jan 1, 2009
686.765
+195.39
39.76%
jan 1, 2010
763.51
+76.745
11.17%
jan 1, 2011
659.274
-104.236
-13.65%
jan 1, 2012
619.992
-39.282
-5.96%
jan 1, 2013
495.517
-124.475
-20.08%
jan 1, 2014
623.896
+128.379
25.91%
jan 1, 2015
578.974
-44.922
-7.2%
Ranking of countries by current statistics by years