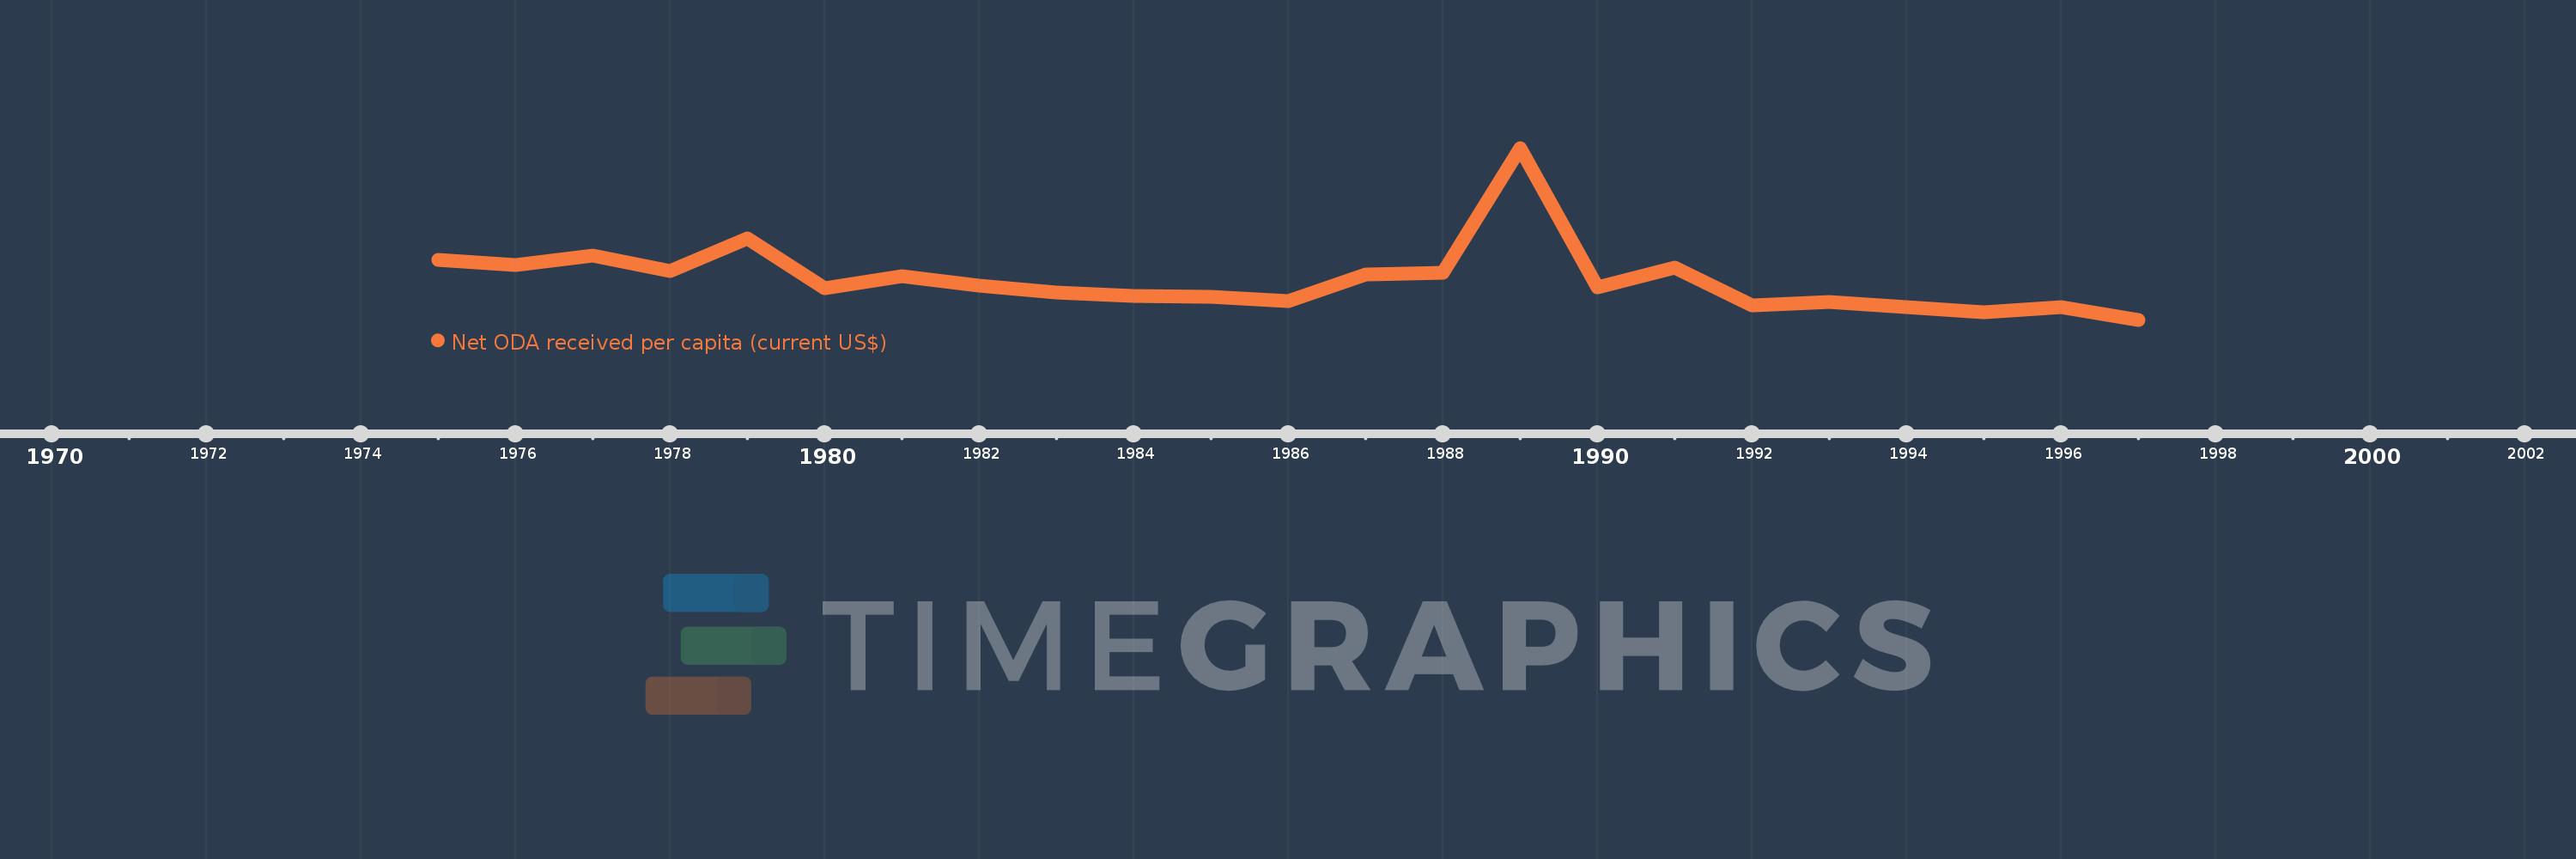
This timeline shows a graph from 1975 to 1997 of Cayman Islands. No data until 1974. Number of actual observations by date: 23.
Source name:
World Development Indicators
Source organization:
Development Assistance Committee of the Organisation for Economic Co-operation and Development, Geographical Distribution of Financial Flows to Developing Countries, Development Co-operation Report, and International Development Statistics database. Data are available online at: www.oecd.org/dac/stats/idsonline. World Bank population estimates are used for the denominator.
Categories, topics:
Aid Effectiveness, Economy & Growth, External Debt
Last updated:
apr 23, 2017
Indicators value changes by year
Meaning:
78.677
Minimum:
-60.534
jan 1, 1997
Maximum:
536.404
jan 1, 1989
At the date of observation
Value
Absolute change
Change from the previous value
jan 1, 1975
146.163
+146.163
0.0%
jan 1, 1976
129.923
-16.24
-11.11%
jan 1, 1977
161.29
+31.367
24.14%
jan 1, 1978
107.659
-53.631
-33.25%
jan 1, 1979
220.964
+113.305
105.24%
jan 1, 1980
47.906
-173.059
-78.32%
jan 1, 1981
92.18
+44.274
92.42%
jan 1, 1982
58.946
-33.234
-36.05%
jan 1, 1983
32.84
-26.106
-44.29%
jan 1, 1984
21.216
-11.624
-35.4%
jan 1, 1985
18.875
-2.341
-11.03%
jan 1, 1986
3.624
-15.251
-80.8%
jan 1, 1987
97.265
+93.641
2.58K%
jan 1, 1988
102.61
+5.345
5.5%
jan 1, 1989
536.404
+433.794
422.76%
jan 1, 1990
51.733
-484.671
-90.36%
jan 1, 1991
119.557
+67.824
131.1%
jan 1, 1992
-11.064
-130.621
-109.25%
jan 1, 1993
0.0
+11.064
-100.0%
jan 1, 1994
-16.055
-16.055
%
jan 1, 1995
-33.938
-17.883
111.39%
jan 1, 1996
-17.997
+15.941
-46.97%
jan 1, 1997
-60.534
-42.537
236.36%
Ranking of countries by current statistics by years