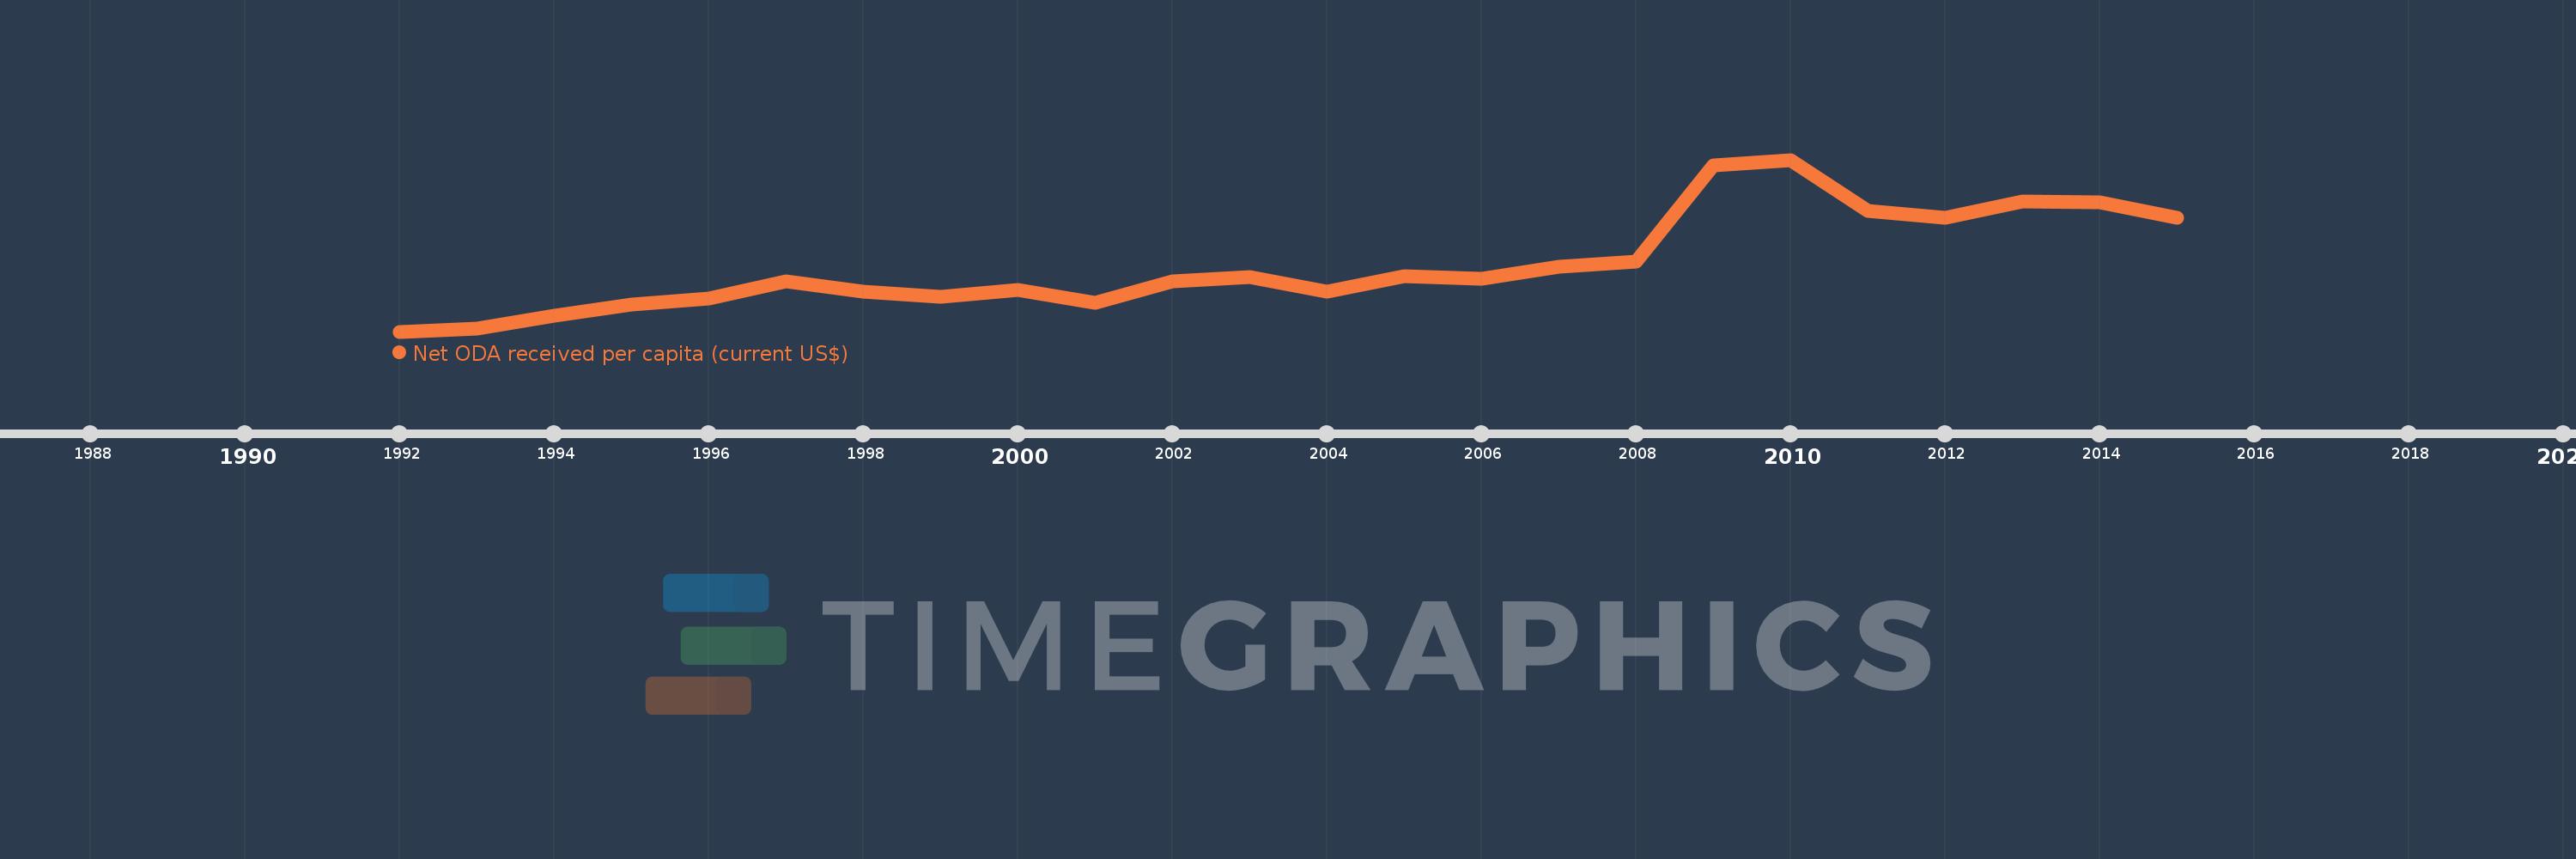
This timeline shows a graph from 1992 to 2015 of Georgia. No data until 1991. Number of actual observations by date: 24.
Source name:
World Development Indicators
Source organization:
Development Assistance Committee of the Organisation for Economic Co-operation and Development, Geographical Distribution of Financial Flows to Developing Countries, Development Co-operation Report, and International Development Statistics database. Data are available online at: www.oecd.org/dac/stats/idsonline. World Bank population estimates are used for the denominator.
Categories, topics:
Aid Effectiveness, Economy & Growth, External Debt
Last updated:
apr 23, 2017
Indicators value changes by year
Meaning:
89.012
Minimum:
0.043
jan 1, 1992
Maximum:
228.18
jan 1, 2010
At the date of observation
Value
Absolute change
Change from the previous value
jan 1, 1992
0.043
+0.043
0.0%
jan 1, 1993
4.176
+4.132
9.52K%
jan 1, 1994
21.335
+17.16
410.95%
jan 1, 1995
36.474
+15.138
70.95%
jan 1, 1996
44.161
+7.688
21.08%
jan 1, 1997
67.02
+22.858
51.76%
jan 1, 1998
53.376
-13.643
-20.36%
jan 1, 1999
46.469
-6.907
-12.94%
jan 1, 2000
54.877
+8.408
18.09%
jan 1, 2001
38.284
-16.593
-30.24%
jan 1, 2002
66.421
+28.137
73.5%
jan 1, 2003
72.169
+5.748
8.65%
jan 1, 2004
53.478
-18.691
-25.9%
jan 1, 2005
73.833
+20.354
38.06%
jan 1, 2006
69.711
-4.122
-5.58%
jan 1, 2007
86.107
+16.396
23.52%
jan 1, 2008
93.006
+6.899
8.01%
jan 1, 2009
220.444
+127.438
137.02%
jan 1, 2010
228.18
+7.736
3.51%
jan 1, 2011
159.901
-68.279
-29.92%
jan 1, 2012
151.729
-8.172
-5.11%
jan 1, 2013
172.667
+20.938
13.8%
jan 1, 2014
171.417
-1.25
-0.72%
jan 1, 2015
151.003
-20.413
-11.91%
Ranking of countries by current statistics by years