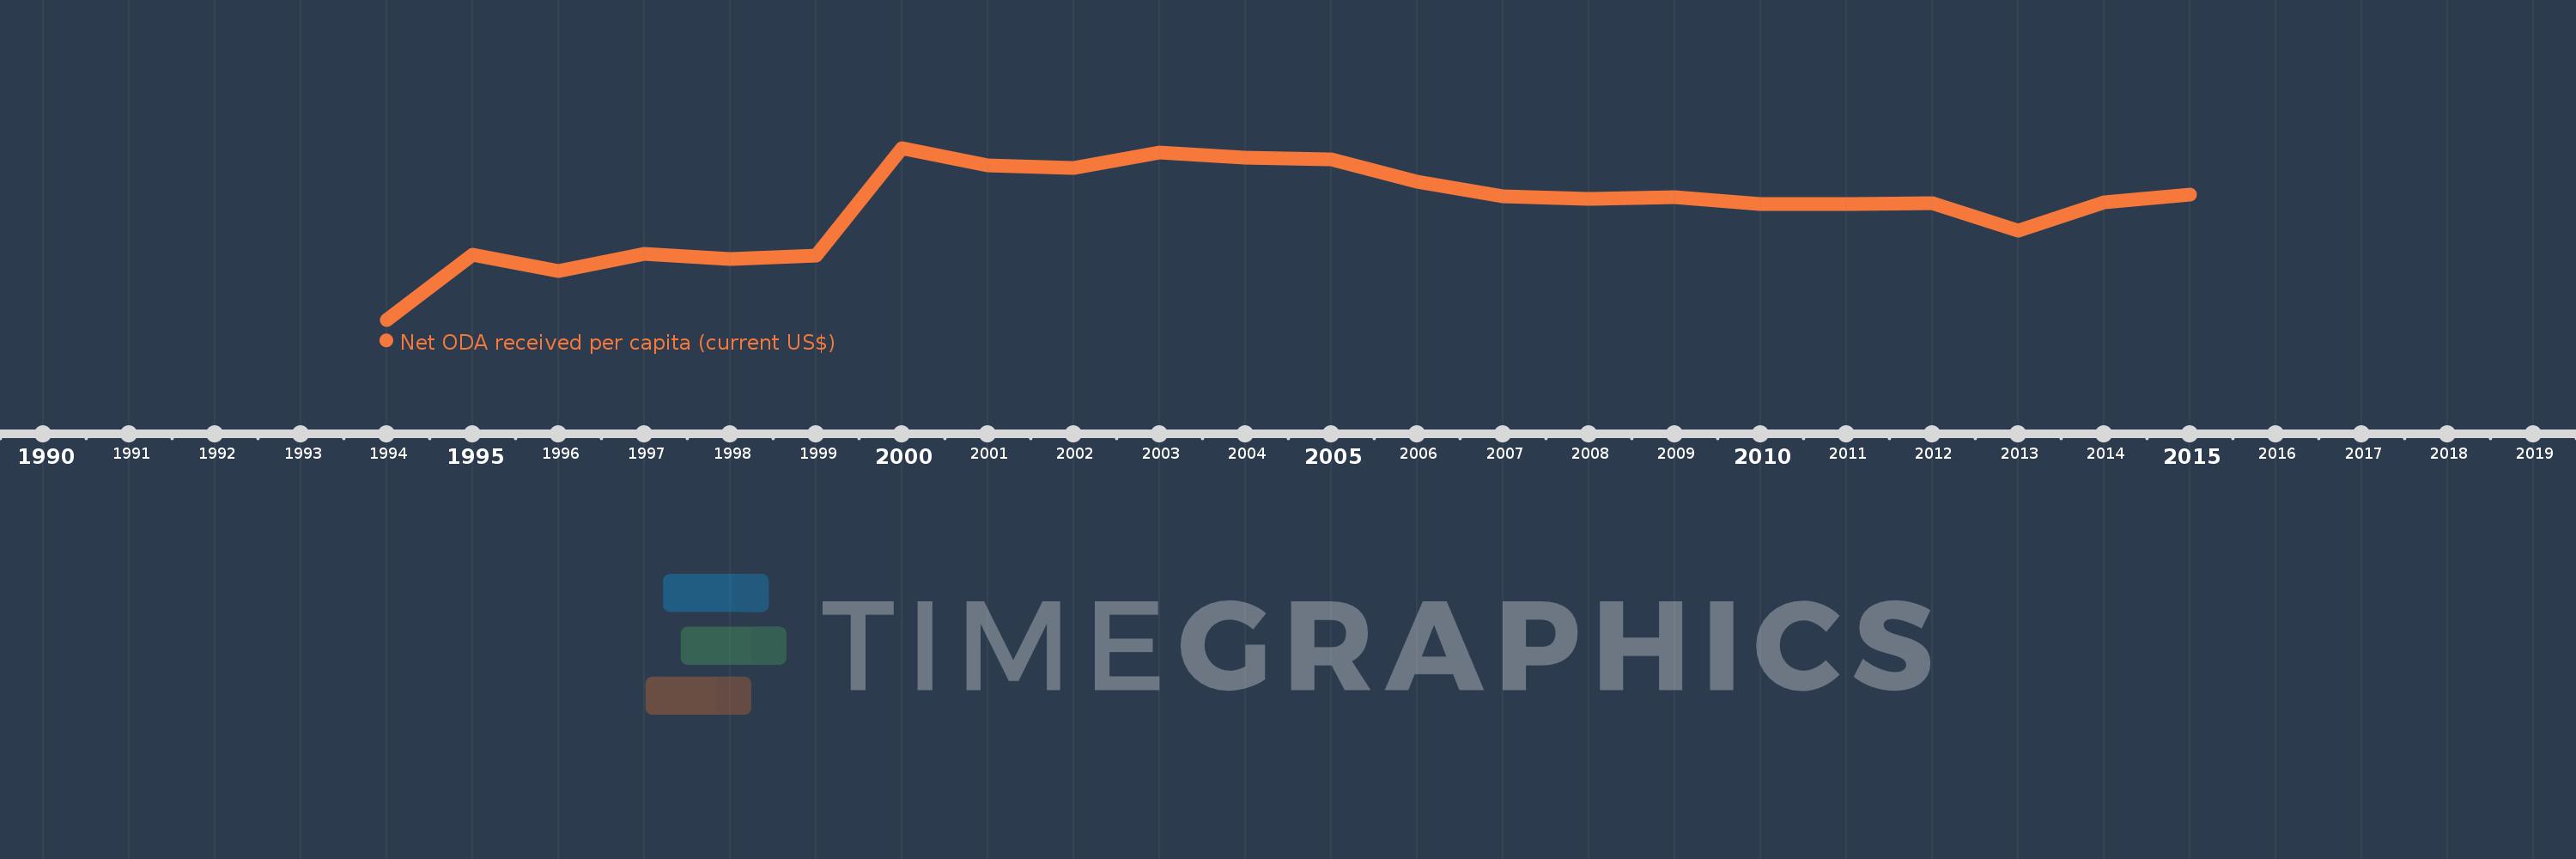
This timeline shows a graph from 1994 to 2015 of Macedonia, FYR. No data until 1993. Number of actual observations by date: 22.
Source name:
World Development Indicators
Source organization:
Development Assistance Committee of the Organisation for Economic Co-operation and Development, Geographical Distribution of Financial Flows to Developing Countries, Development Co-operation Report, and International Development Statistics database. Data are available online at: www.oecd.org/dac/stats/idsonline. World Bank population estimates are used for the denominator.
Categories, topics:
Aid Effectiveness, Economy & Growth, External Debt
Last updated:
apr 23, 2017
Indicators value changes by year
Meaning:
90.494
Minimum:
1.69
jan 1, 1994
Maximum:
138.459
jan 1, 2000
At the date of observation
Value
Absolute change
Change from the previous value
jan 1, 1994
1.69
+1.69
0.0%
jan 1, 1995
53.298
+51.609
3.05K%
jan 1, 1996
40.337
-12.961
-24.32%
jan 1, 1997
53.817
+13.48
33.42%
jan 1, 1998
49.905
-3.912
-7.27%
jan 1, 1999
52.872
+2.967
5.94%
jan 1, 2000
138.459
+85.588
161.88%
jan 1, 2001
124.346
-14.113
-10.19%
jan 1, 2002
122.28
-2.065
-1.66%
jan 1, 2003
134.83
+12.549
10.26%
jan 1, 2004
130.646
-4.184
-3.1%
jan 1, 2005
129.236
-1.41
-1.08%
jan 1, 2006
111.264
-17.972
-13.91%
jan 1, 2007
100.253
-11.011
-9.9%
jan 1, 2008
97.849
-2.404
-2.4%
jan 1, 2009
99.603
+1.754
1.79%
jan 1, 2010
93.481
-6.122
-6.15%
jan 1, 2011
93.496
+0.015
0.02%
jan 1, 2012
94.153
+0.657
0.7%
jan 1, 2013
72.34
-21.814
-23.17%
jan 1, 2014
95.163
+22.824
31.55%
jan 1, 2015
101.545
+6.382
6.71%
Ranking of countries by current statistics by years