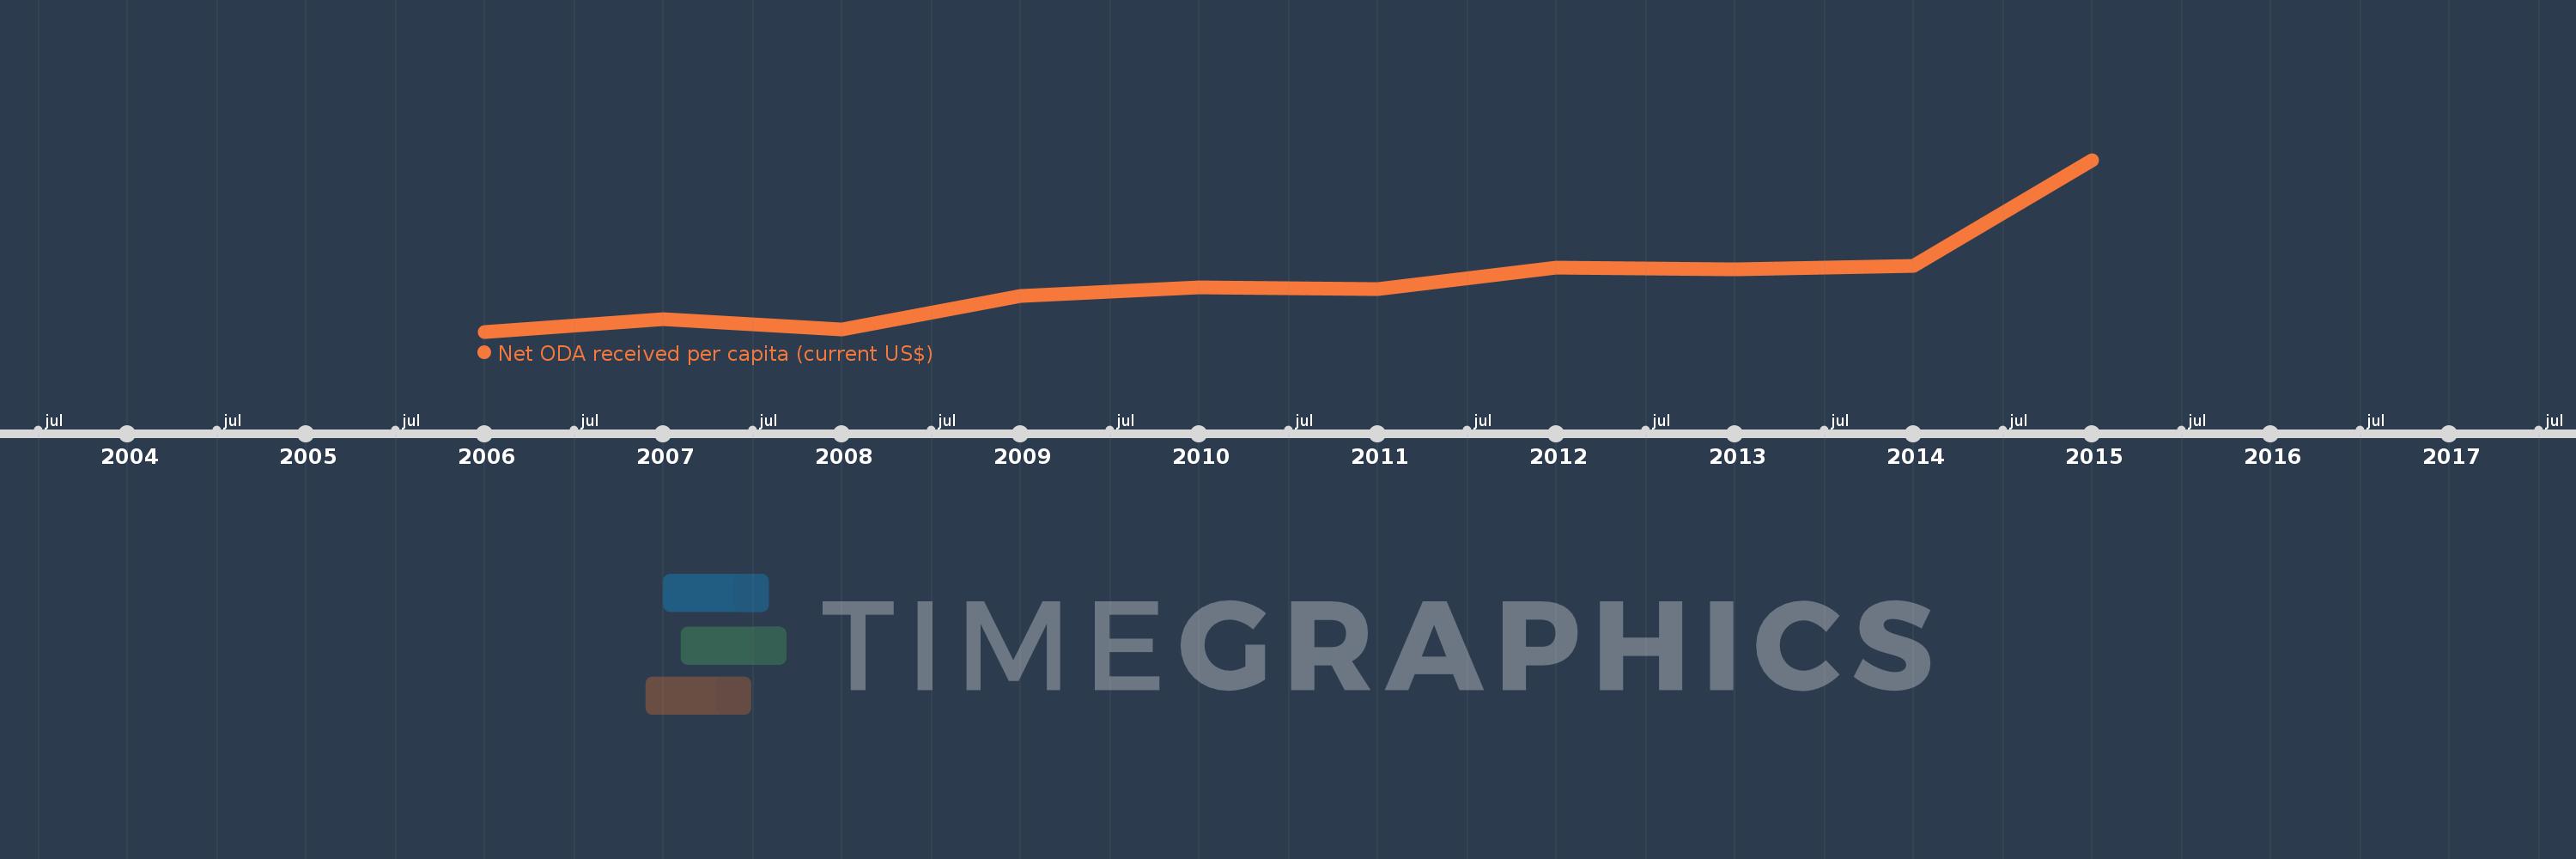
This timeline shows a graph from 2006 to 2015 of Ukraine. No data until 2005. Number of actual observations by date: 10.
Source name:
World Development Indicators
Source organization:
Development Assistance Committee of the Organisation for Economic Co-operation and Development, Geographical Distribution of Financial Flows to Developing Countries, Development Co-operation Report, and International Development Statistics database. Data are available online at: www.oecd.org/dac/stats/idsonline. World Bank population estimates are used for the denominator.
Categories, topics:
Aid Effectiveness, Economy & Growth, External Debt
Last updated:
apr 23, 2017
Indicators value changes by year
Meaning:
15.21
Minimum:
8.74
jan 1, 2006
Maximum:
30.943
jan 1, 2015
At the date of observation
Value
Absolute change
Change from the previous value
jan 1, 2006
8.74
+8.74
0.0%
jan 1, 2007
10.334
+1.594
18.24%
jan 1, 2008
9.036
-1.297
-12.56%
jan 1, 2009
13.359
+4.323
47.84%
jan 1, 2010
14.467
+1.108
8.29%
jan 1, 2011
14.2
-0.267
-1.84%
jan 1, 2012
16.959
+2.759
19.43%
jan 1, 2013
16.836
-0.124
-0.73%
jan 1, 2014
17.223
+0.387
2.3%
jan 1, 2015
30.943
+13.72
79.66%
Ranking of countries by current statistics by years