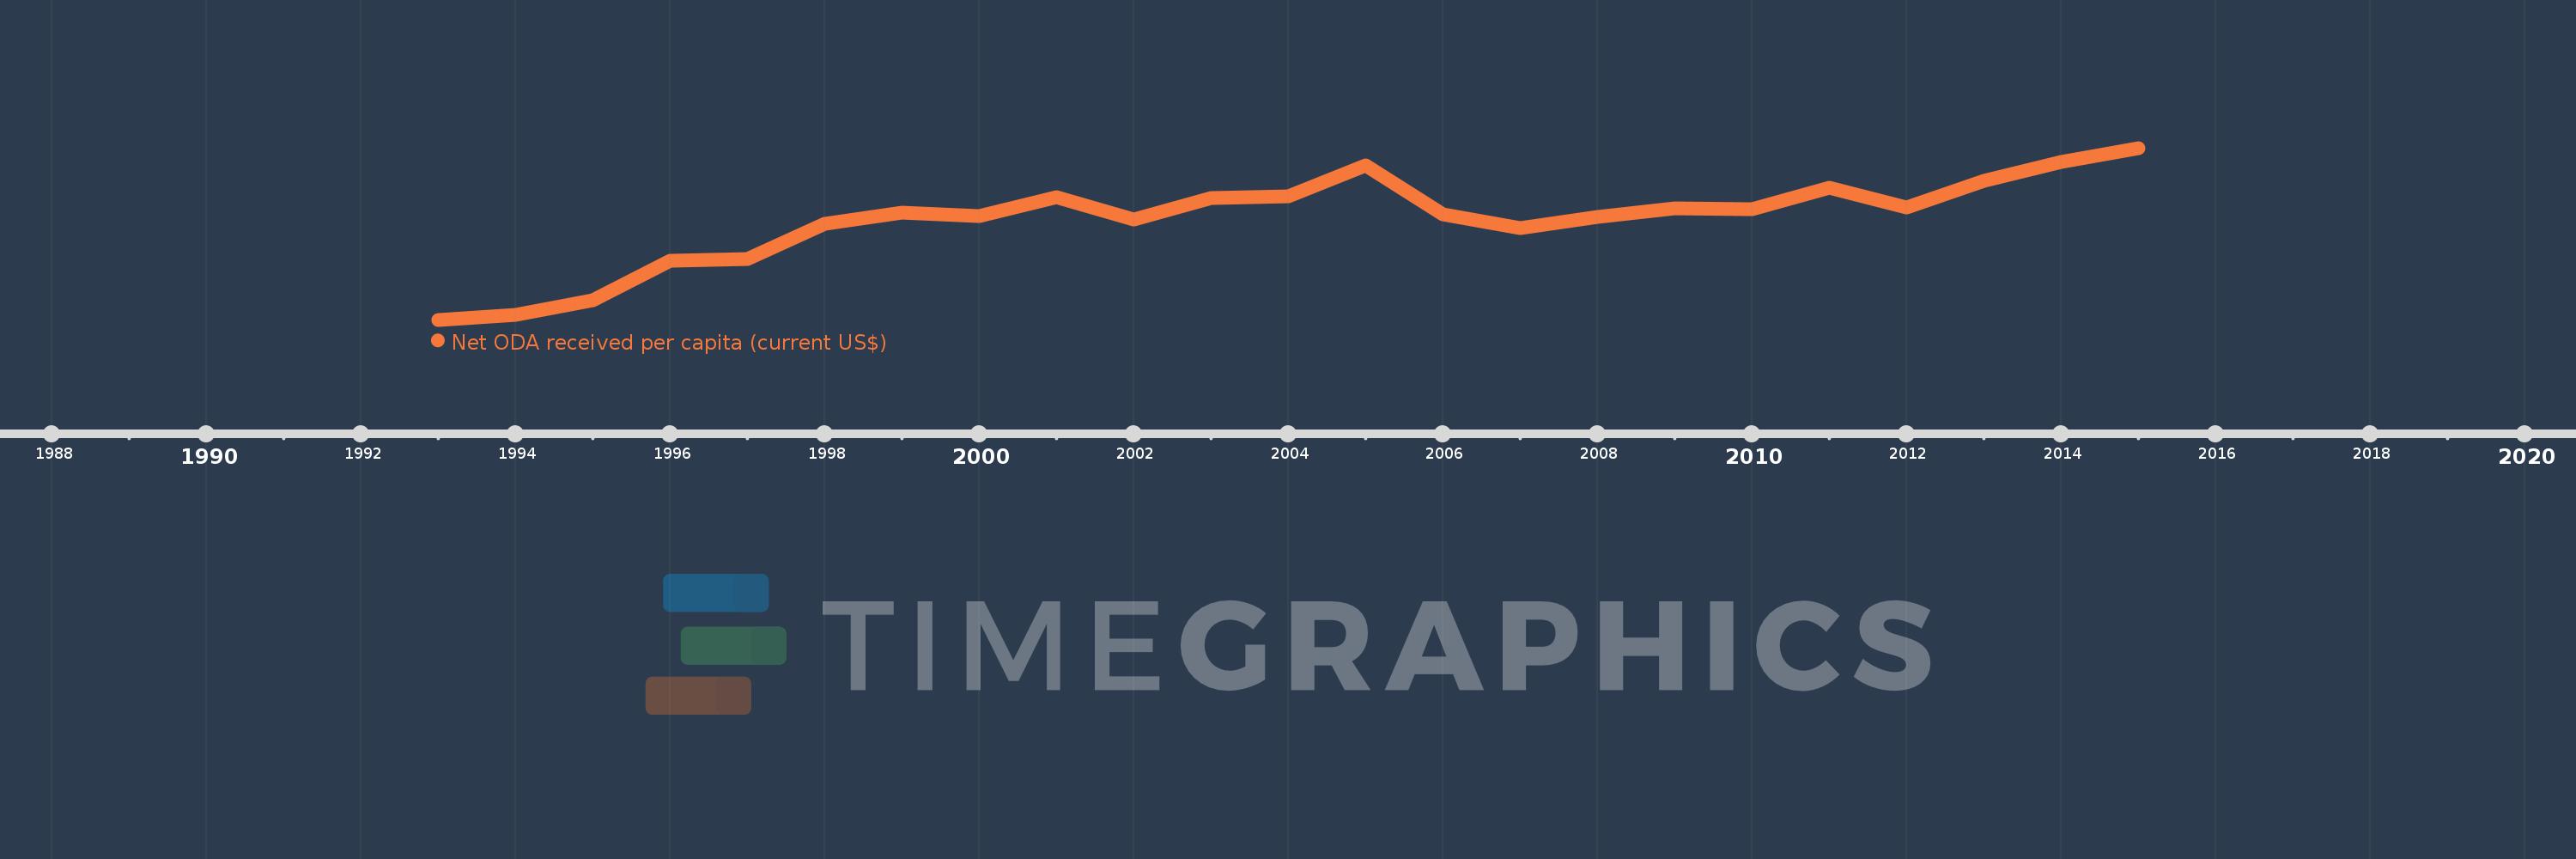
This timeline shows a graph from 1993 to 2015 of Uzbekistan. No data until 1992. Number of actual observations by date: 23.
Source name:
World Development Indicators
Source organization:
Development Assistance Committee of the Organisation for Economic Co-operation and Development, Geographical Distribution of Financial Flows to Developing Countries, Development Co-operation Report, and International Development Statistics database. Data are available online at: www.oecd.org/dac/stats/idsonline. World Bank population estimates are used for the denominator.
Categories, topics:
Aid Effectiveness, Economy & Growth, External Debt
Last updated:
apr 23, 2017
Indicators value changes by year
Meaning:
6.188
Minimum:
0.07
jan 1, 1993
Maximum:
10.547
jan 1, 2015
At the date of observation
Value
Absolute change
Change from the previous value
jan 1, 1993
0.07
+0.07
0.0%
jan 1, 1994
0.364
+0.293
416.6%
jan 1, 1995
1.262
+0.899
247.13%
jan 1, 1996
3.674
+2.412
191.05%
jan 1, 1997
3.776
+0.101
2.76%
jan 1, 1998
5.903
+2.127
56.35%
jan 1, 1999
6.583
+0.68
11.52%
jan 1, 2000
6.392
-0.191
-2.9%
jan 1, 2001
7.535
+1.143
17.89%
jan 1, 2002
6.164
-1.371
-18.2%
jan 1, 2003
7.489
+1.325
21.49%
jan 1, 2004
7.609
+0.121
1.61%
jan 1, 2005
9.507
+1.898
24.94%
jan 1, 2006
6.489
-3.018
-31.75%
jan 1, 2007
5.636
-0.852
-13.13%
jan 1, 2008
6.322
+0.685
12.16%
jan 1, 2009
6.861
+0.539
8.53%
jan 1, 2010
6.834
-0.027
-0.4%
jan 1, 2011
8.125
+1.292
18.9%
jan 1, 2012
6.941
-1.185
-14.58%
jan 1, 2013
8.562
+1.622
23.36%
jan 1, 2014
9.68
+1.117
13.05%
jan 1, 2015
10.547
+0.867
8.96%
Ranking of countries by current statistics by years