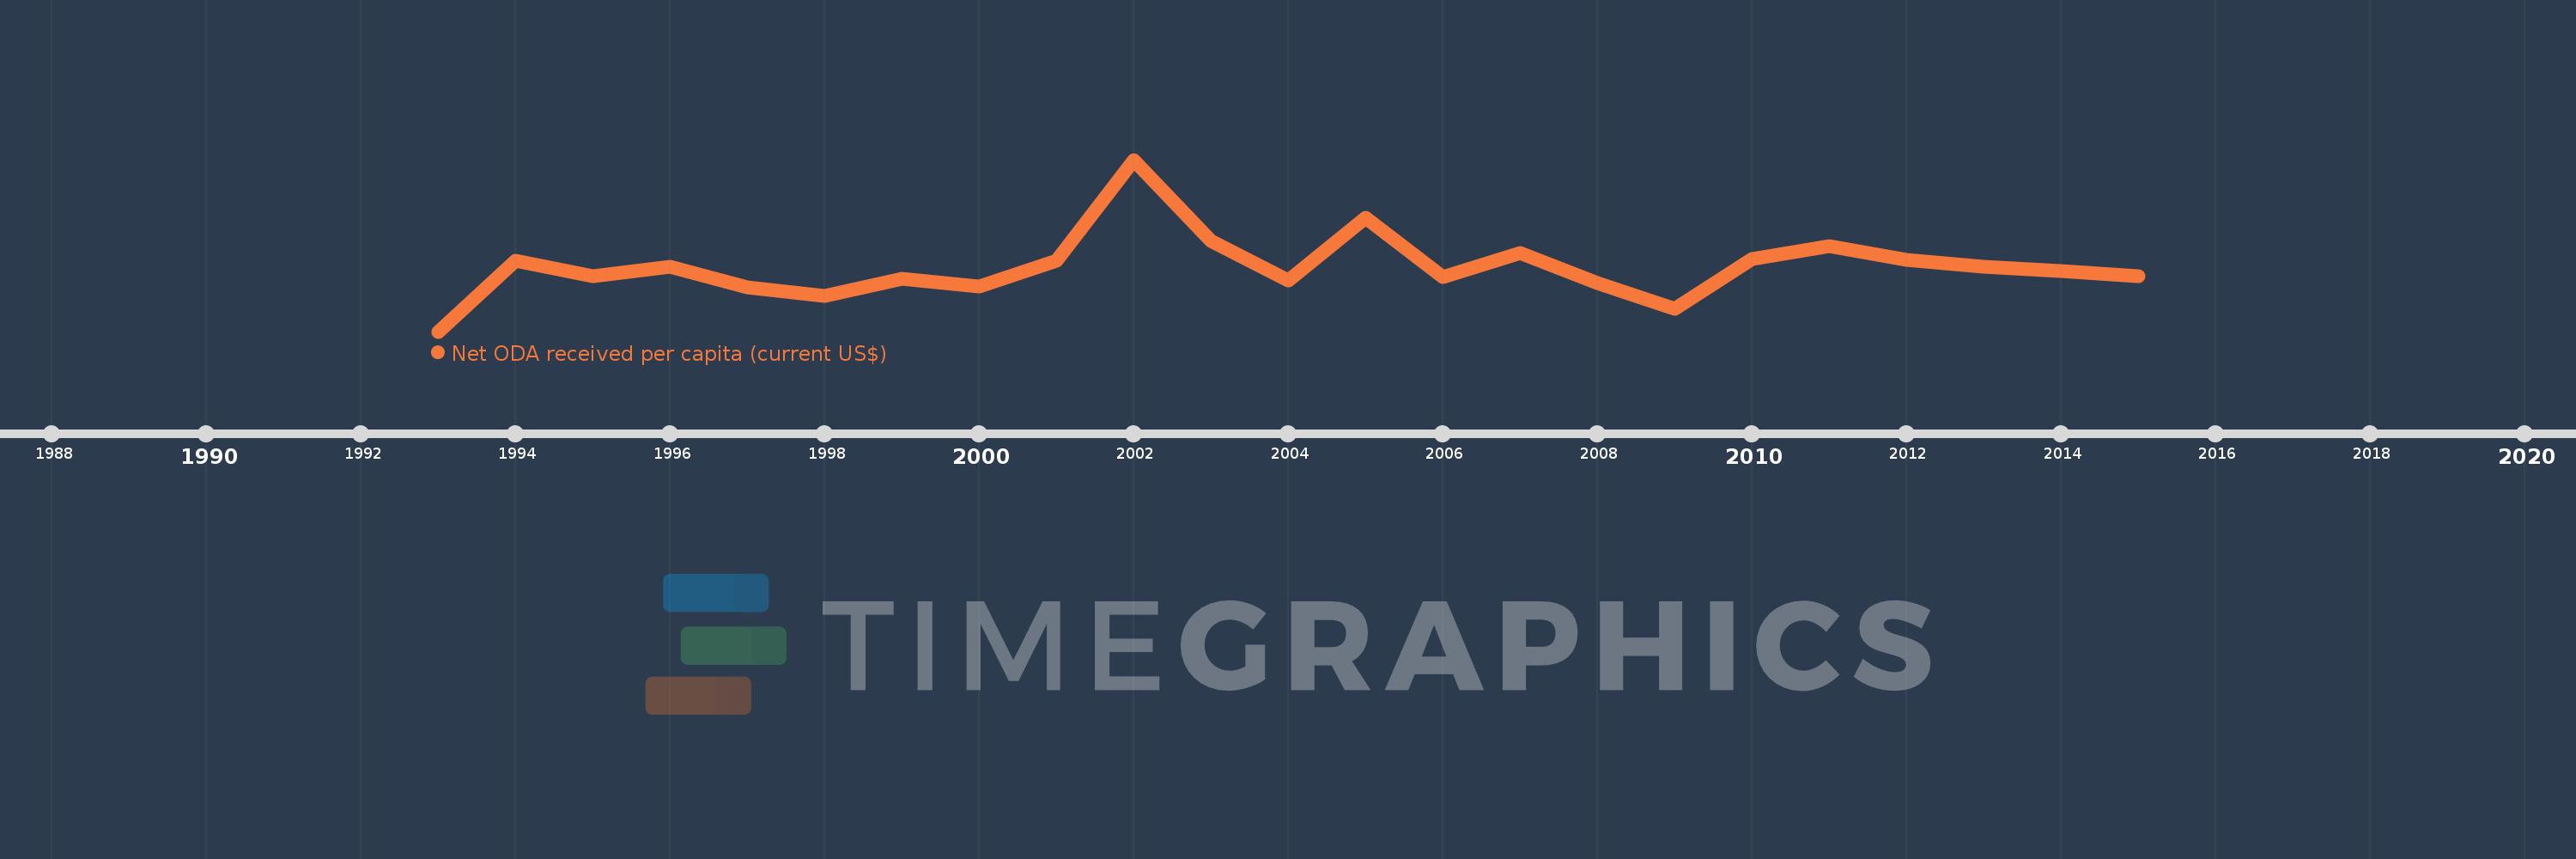
This timeline shows a graph from 1993 to 2015 of Turkmenistan. No data until 1992. Number of actual observations by date: 23.
Source name:
World Development Indicators
Source organization:
Development Assistance Committee of the Organisation for Economic Co-operation and Development, Geographical Distribution of Financial Flows to Developing Countries, Development Co-operation Report, and International Development Statistics database. Data are available online at: www.oecd.org/dac/stats/idsonline. World Bank population estimates are used for the denominator.
Categories, topics:
Aid Effectiveness, Economy & Growth, External Debt
Last updated:
apr 23, 2017
Indicators value changes by year
Meaning:
7.265
Minimum:
1.698
jan 1, 1993
Maximum:
16.534
jan 1, 2002
At the date of observation
Value
Absolute change
Change from the previous value
jan 1, 1993
1.698
+1.698
0.0%
jan 1, 1994
7.788
+6.091
358.78%
jan 1, 1995
6.49
-1.298
-16.67%
jan 1, 1996
7.33
+0.84
12.95%
jan 1, 1997
5.539
-1.791
-24.43%
jan 1, 1998
4.774
-0.765
-13.82%
jan 1, 1999
6.236
+1.462
30.63%
jan 1, 2000
5.614
-0.622
-9.97%
jan 1, 2001
7.842
+2.228
39.68%
jan 1, 2002
16.534
+8.692
110.84%
jan 1, 2003
9.506
-7.028
-42.51%
jan 1, 2004
6.145
-3.362
-35.36%
jan 1, 2005
11.552
+5.408
88.01%
jan 1, 2006
6.397
-5.156
-44.63%
jan 1, 2007
8.478
+2.082
32.55%
jan 1, 2008
5.862
-2.616
-30.86%
jan 1, 2009
3.687
-2.175
-37.11%
jan 1, 2010
8.002
+4.315
117.04%
jan 1, 2011
9.078
+1.076
13.45%
jan 1, 2012
7.919
-1.159
-12.76%
jan 1, 2013
7.276
-0.643
-8.12%
jan 1, 2014
6.899
-0.378
-5.19%
jan 1, 2015
6.452
-0.447
-6.48%
Ranking of countries by current statistics by years