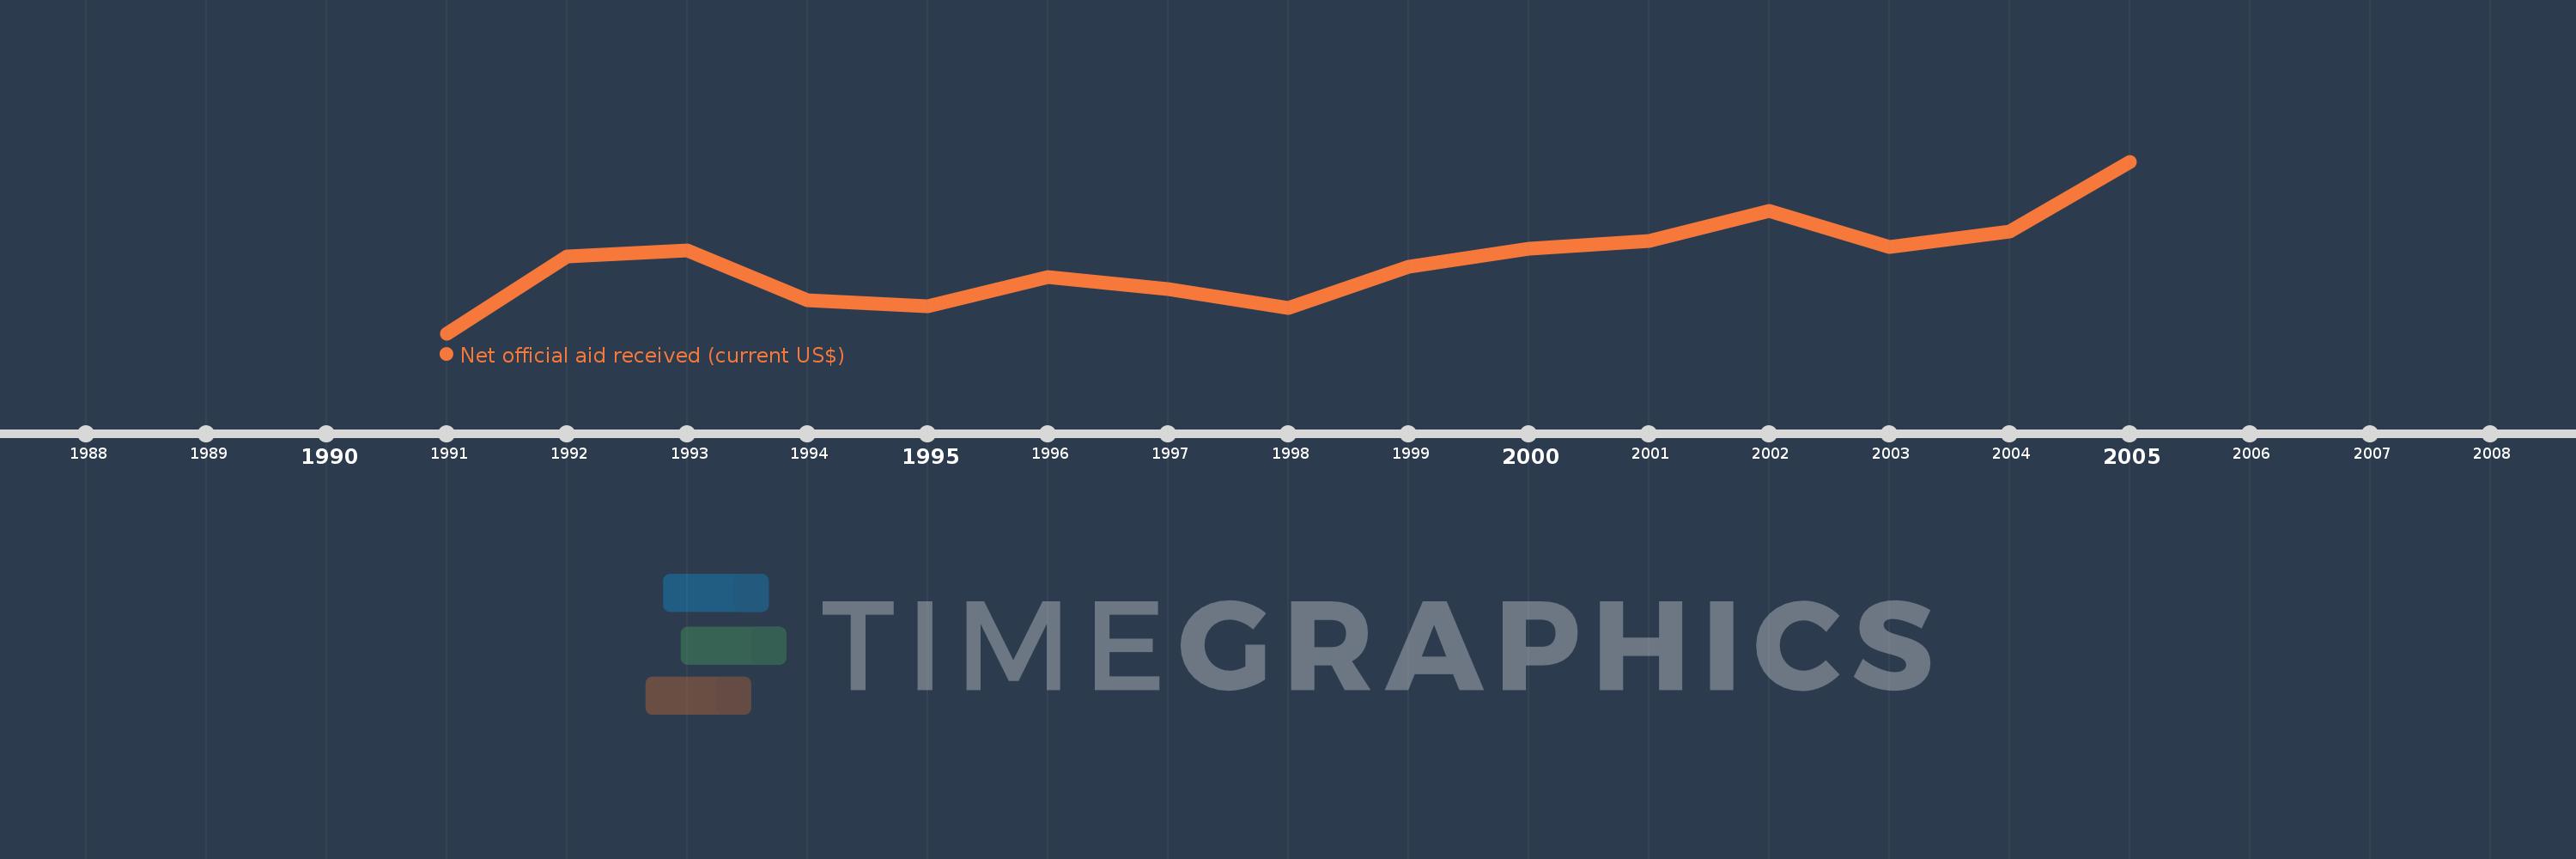
This timeline shows a graph from 1991 to 2005 of Middle income. No data until 1990. Number of actual observations by date: 15.
Source name:
World Development Indicators
Source organization:
Development Assistance Committee of the Organisation for Economic Co-operation and Development, Geographical Distribution of Financial Flows to Developing Countries, Development Co-operation Report, and International Development Statistics database. Data are available online at: www.oecd.org/dac/stats/idsonline.
Categories, topics:
Aid Effectiveness
Last updated:
apr 23, 2017
Indicators value changes by year
Meaning:
1.148 bln
Minimum:
546.02 mln
jan 1, 1991
Maximum:
1.993 bln
jan 1, 2005
At the date of observation
Value
Absolute change
Change from the previous value
jan 1, 1991
546.02 mln
+546.02 mln
0.0%
jan 1, 1992
1.192 bln
+645.74 mln
118.26%
jan 1, 1993
1.246 bln
+53.78 mln
4.51%
jan 1, 1994
823.84 mln
-421.7 mln
-33.86%
jan 1, 1995
774.77 mln
-49.07 mln
-5.96%
jan 1, 1996
1.018 bln
+243.71 mln
31.46%
jan 1, 1997
921.29 mln
-97.19 mln
-9.54%
jan 1, 1998
760.07 mln
-161.22 mln
-17.5%
jan 1, 1999
1.108 bln
+347.59 mln
45.73%
jan 1, 2000
1.26 bln
+152.1 mln
13.73%
jan 1, 2001
1.325 bln
+65.11 mln
5.17%
jan 1, 2002
1.575 bln
+250.62 mln
18.92%
jan 1, 2003
1.273 bln
-302.41 mln
-19.19%
jan 1, 2004
1.406 bln
+132.67 mln
10.42%
jan 1, 2005
1.993 bln
+587.52 mln
41.79%
Ranking of countries by current statistics by years