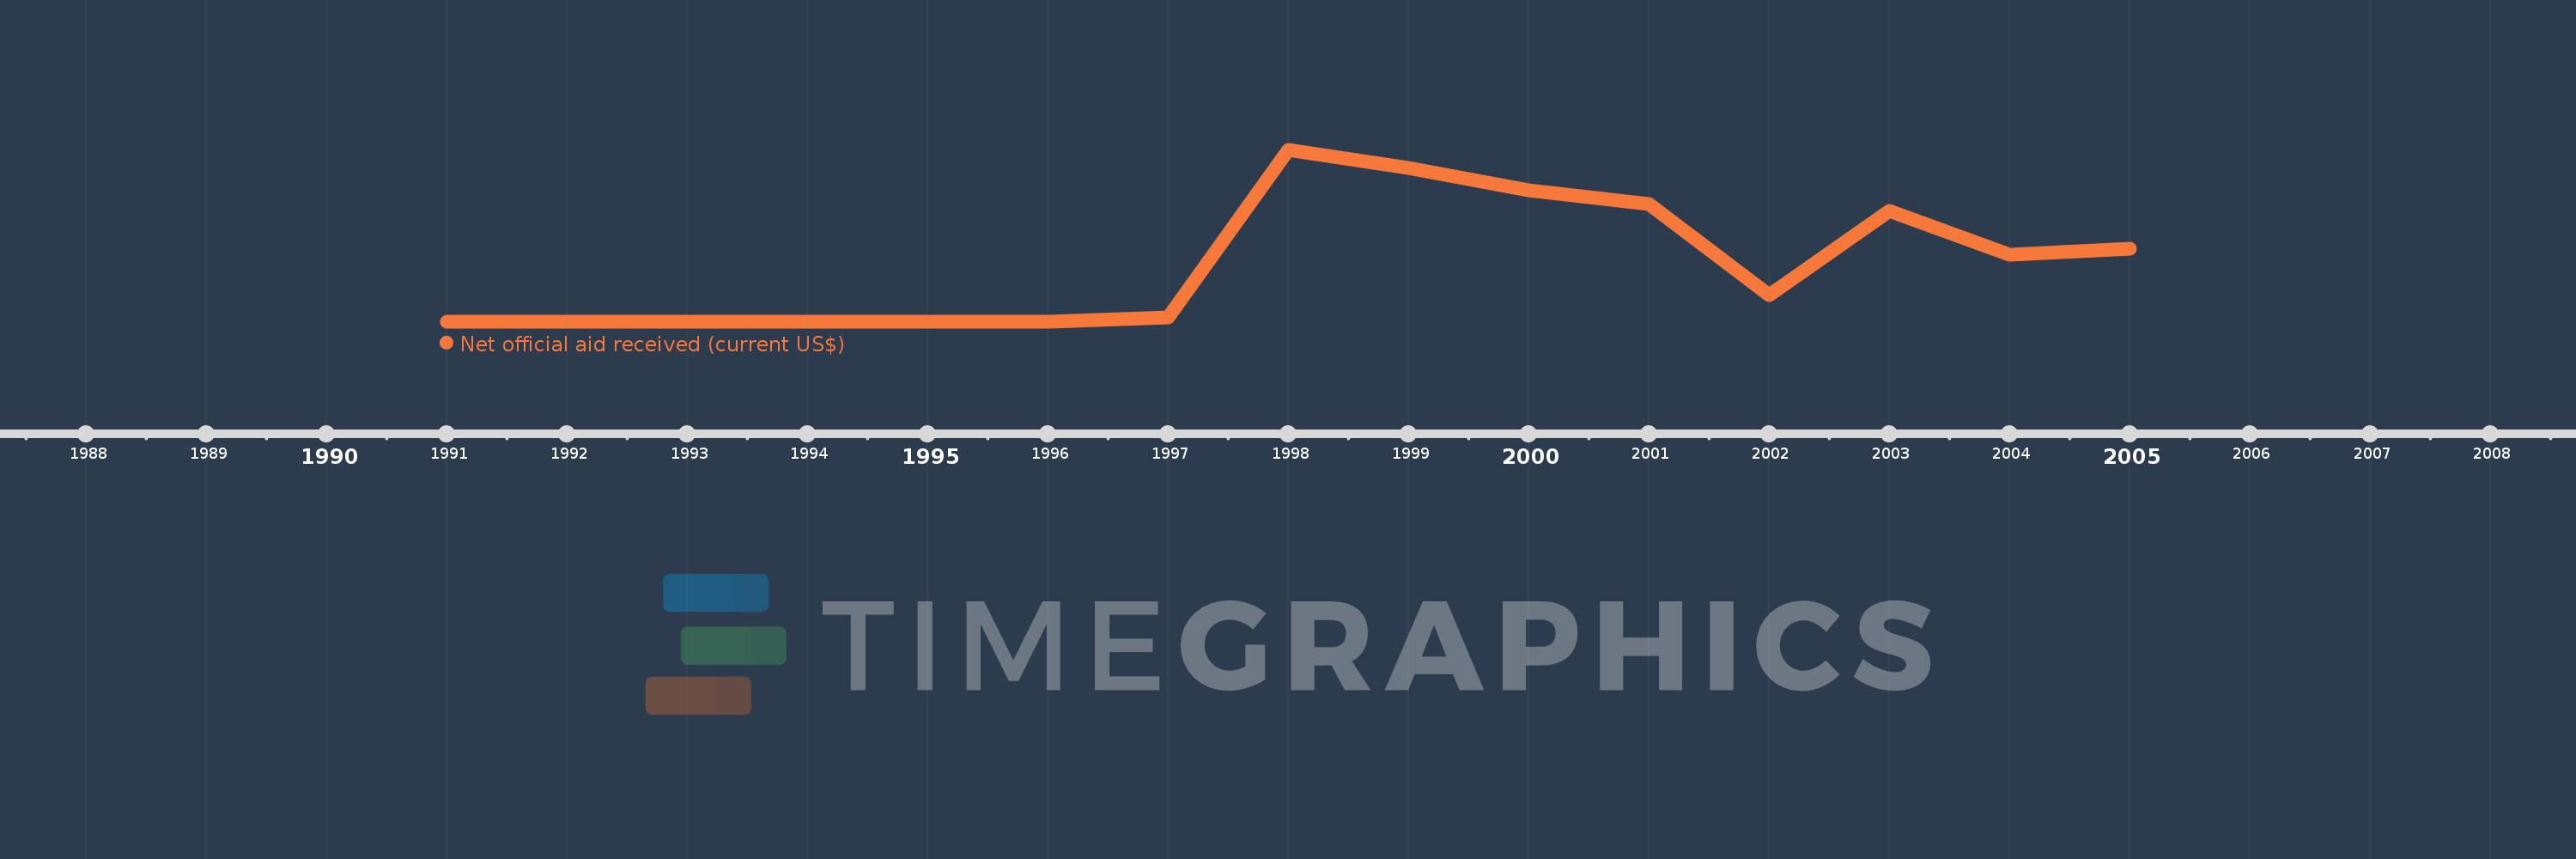
This timeline shows a graph from 1991 to 2005 of Middle East & North Africa. No data until 1990. Number of actual observations by date: 15.
Source name:
World Development Indicators
Source organization:
Development Assistance Committee of the Organisation for Economic Co-operation and Development, Geographical Distribution of Financial Flows to Developing Countries, Development Co-operation Report, and International Development Statistics database. Data are available online at: www.oecd.org/dac/stats/idsonline.
Categories, topics:
Aid Effectiveness
Last updated:
apr 23, 2017
Indicators value changes by year
Meaning:
400.87 mln
Minimum:
0.0
jan 1, 1991
Maximum:
1.201 bln
jan 1, 1998
At the date of observation
Value
Absolute change
Change from the previous value
jan 1, 1991
0.0
0.0
0.0%
jan 1, 1992
0.0
0.0
%
jan 1, 1993
0.0
0.0
%
jan 1, 1994
0.0
0.0
%
jan 1, 1995
0.0
0.0
%
jan 1, 1996
0.0
0.0
%
jan 1, 1997
34.59 mln
+34.59 mln
%
jan 1, 1998
1.201 bln
+1.167 bln
3.37K%
jan 1, 1999
1.079 bln
-122.25 mln
-10.18%
jan 1, 2000
923.71 mln
-155.47 mln
-14.41%
jan 1, 2001
822.78 mln
-100.93 mln
-10.93%
jan 1, 2002
190.46 mln
-632.32 mln
-76.85%
jan 1, 2003
778.31 mln
+587.85 mln
308.65%
jan 1, 2004
472.35 mln
-305.96 mln
-39.31%
jan 1, 2005
510.24 mln
+37.89 mln
8.02%
Ranking of countries by current statistics by years