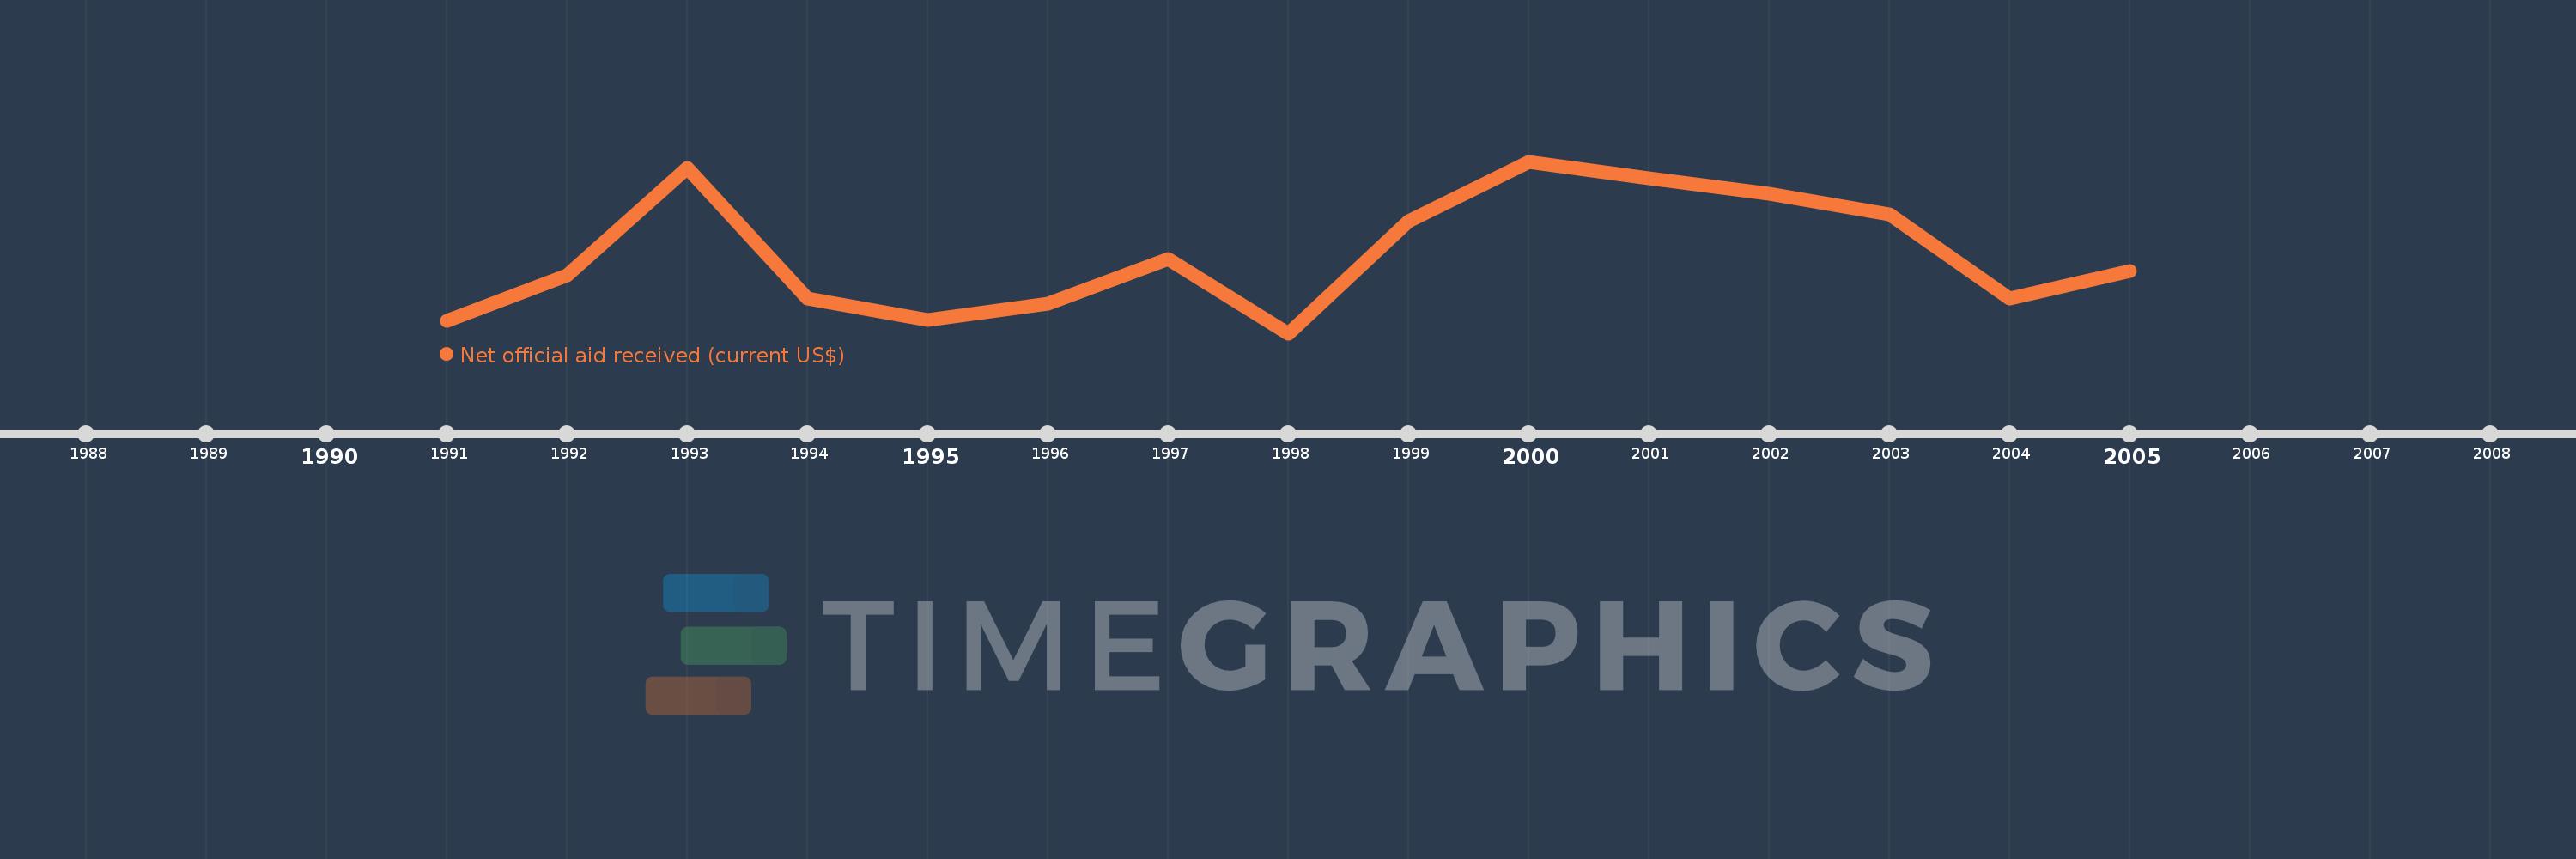
This timeline shows a graph from 1991 to 2005 of Ukraine. No data until 1990. Number of actual observations by date: 15.
Source name:
World Development Indicators
Source organization:
Development Assistance Committee of the Organisation for Economic Co-operation and Development, Geographical Distribution of Financial Flows to Developing Countries, Development Co-operation Report, and International Development Statistics database. Data are available online at: www.oecd.org/dac/stats/idsonline.
Categories, topics:
Aid Effectiveness
Last updated:
apr 23, 2017
Indicators value changes by year
Meaning:
405.343 mln
Minimum:
267.3 mln
jan 1, 1998
Maximum:
568.56 mln
jan 1, 2000
At the date of observation
Value
Absolute change
Change from the previous value
jan 1, 1991
289.0 mln
+289.0 mln
0.0%
jan 1, 1992
368.3 mln
+79.3 mln
27.44%
jan 1, 1993
557.6 mln
+189.3 mln
51.4%
jan 1, 1994
327.89 mln
-229.71 mln
-41.2%
jan 1, 1995
289.95 mln
-37.94 mln
-11.57%
jan 1, 1996
319.22 mln
+29.27 mln
10.09%
jan 1, 1997
397.62 mln
+78.4 mln
24.56%
jan 1, 1998
267.3 mln
-130.32 mln
-32.78%
jan 1, 1999
463.76 mln
+196.46 mln
73.5%
jan 1, 2000
568.56 mln
+104.8 mln
22.6%
jan 1, 2001
538.72 mln
-29.84 mln
-5.25%
jan 1, 2002
512.47 mln
-26.25 mln
-4.87%
jan 1, 2003
475.55 mln
-36.92 mln
-7.2%
jan 1, 2004
328.22 mln
-147.33 mln
-30.98%
jan 1, 2005
375.99 mln
+47.77 mln
14.55%
Ranking of countries by current statistics by years