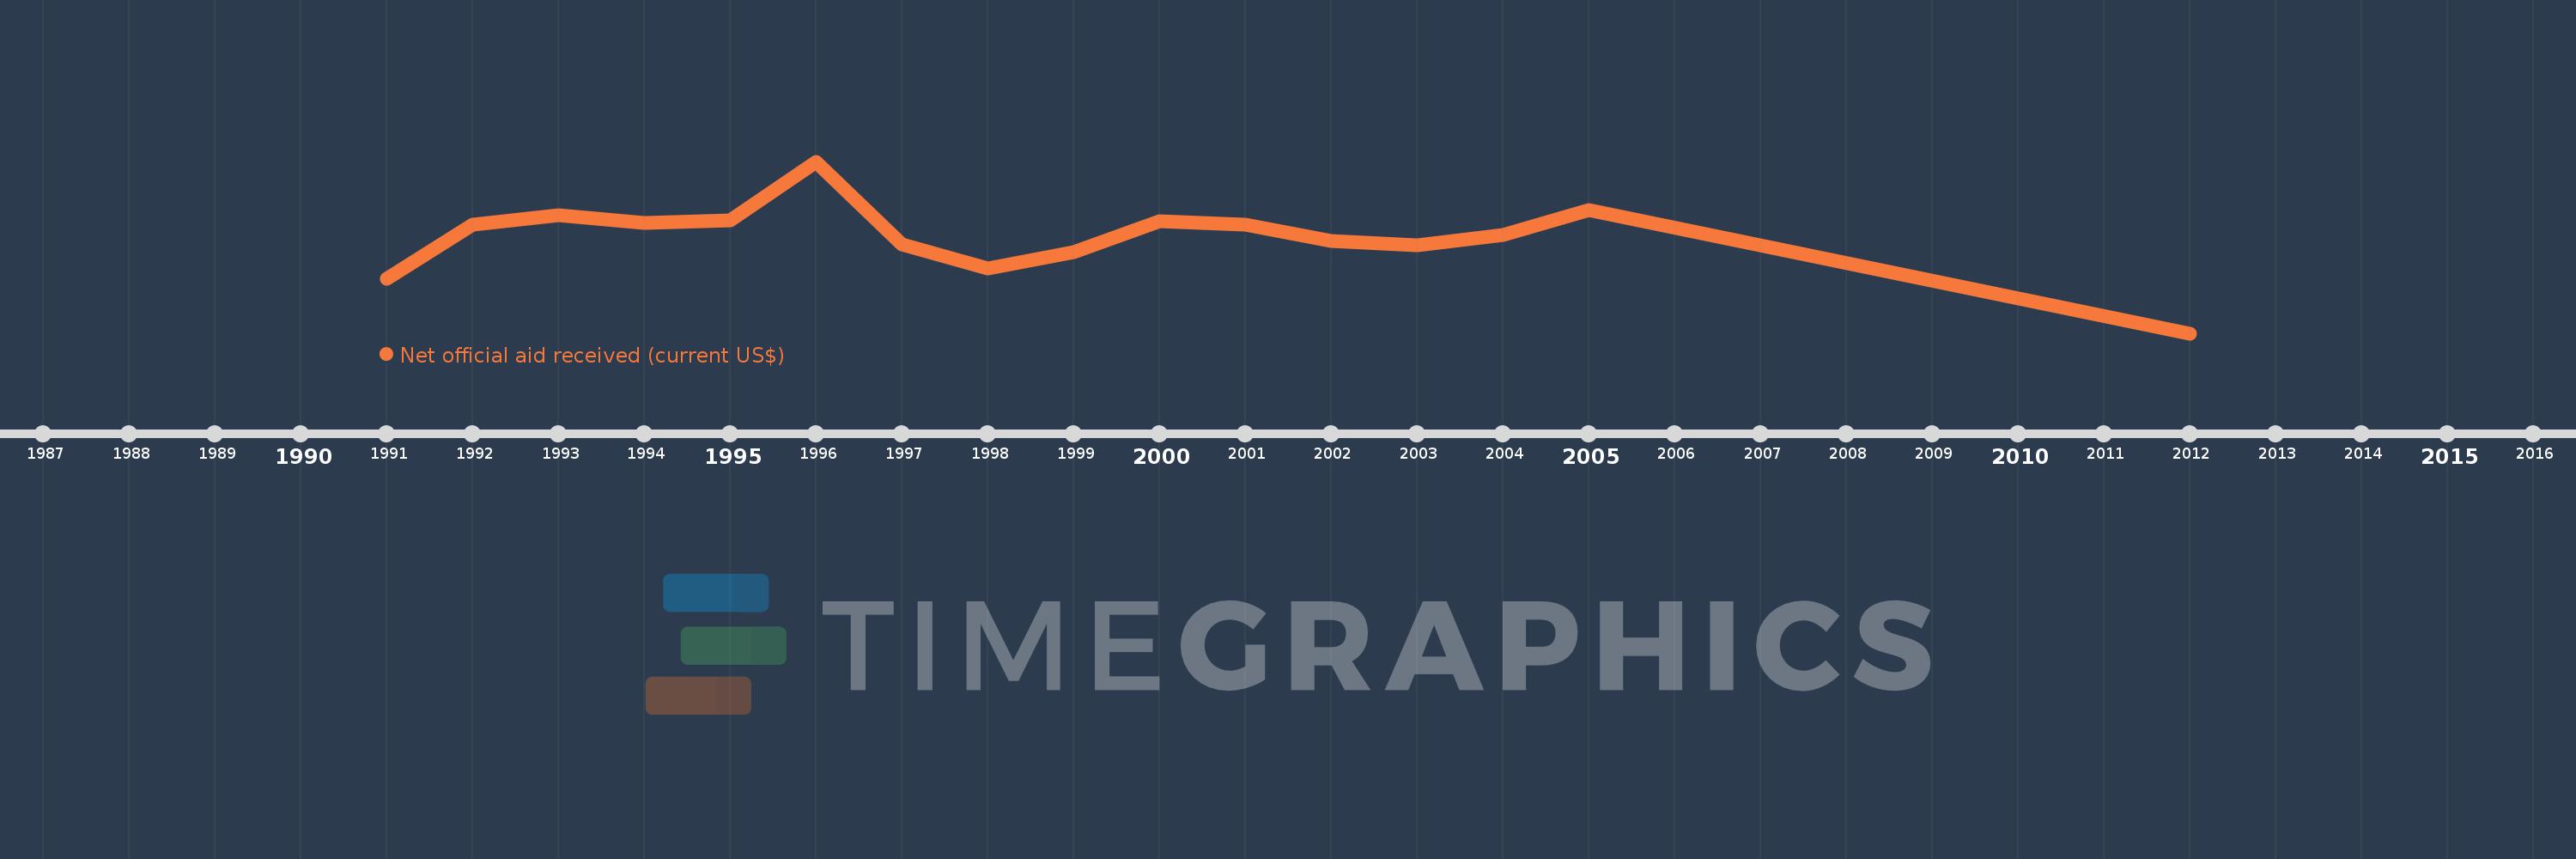
This timeline shows a graph from 1991 to 2012 of Europe & Central Asia (IDA & IBRD countries). No data until 1990. Number of actual observations by date: 16.
Source name:
World Development Indicators
Source organization:
Development Assistance Committee of the Organisation for Economic Co-operation and Development, Geographical Distribution of Financial Flows to Developing Countries, Development Co-operation Report, and International Development Statistics database. Data are available online at: www.oecd.org/dac/stats/idsonline.
Categories, topics:
Aid Effectiveness
Last updated:
apr 23, 2017
Indicators value changes by year
Meaning:
3.751 bln
Minimum:
280.0K
jan 1, 2012
Maximum:
6.724 bln
jan 1, 1996
At the date of observation
Value
Absolute change
Change from the previous value
jan 1, 1991
2.12 bln
+2.12 bln
0.0%
jan 1, 1992
4.263 bln
+2.142 bln
101.04%
jan 1, 1993
4.616 bln
+353.44 mln
8.29%
jan 1, 1994
4.315 bln
-301.37 mln
-6.53%
jan 1, 1995
4.431 bln
+116.38 mln
2.7%
jan 1, 1996
6.724 bln
+2.293 bln
51.75%
jan 1, 1997
3.489 bln
-3.235 bln
-48.12%
jan 1, 1998
2.524 bln
-965.25 mln
-27.67%
jan 1, 1999
3.166 bln
+642.55 mln
25.46%
jan 1, 2000
4.376 bln
+1.21 bln
38.22%
jan 1, 2001
4.258 bln
-117.98 mln
-2.7%
jan 1, 2002
3.621 bln
-637.26 mln
-14.97%
jan 1, 2003
3.441 bln
-180.2 mln
-4.98%
jan 1, 2004
3.838 bln
+397.31 mln
11.55%
jan 1, 2005
4.834 bln
+995.93 mln
25.95%
jan 1, 2012
280.0K
-4.834 bln
-99.99%
Ranking of countries by current statistics by years