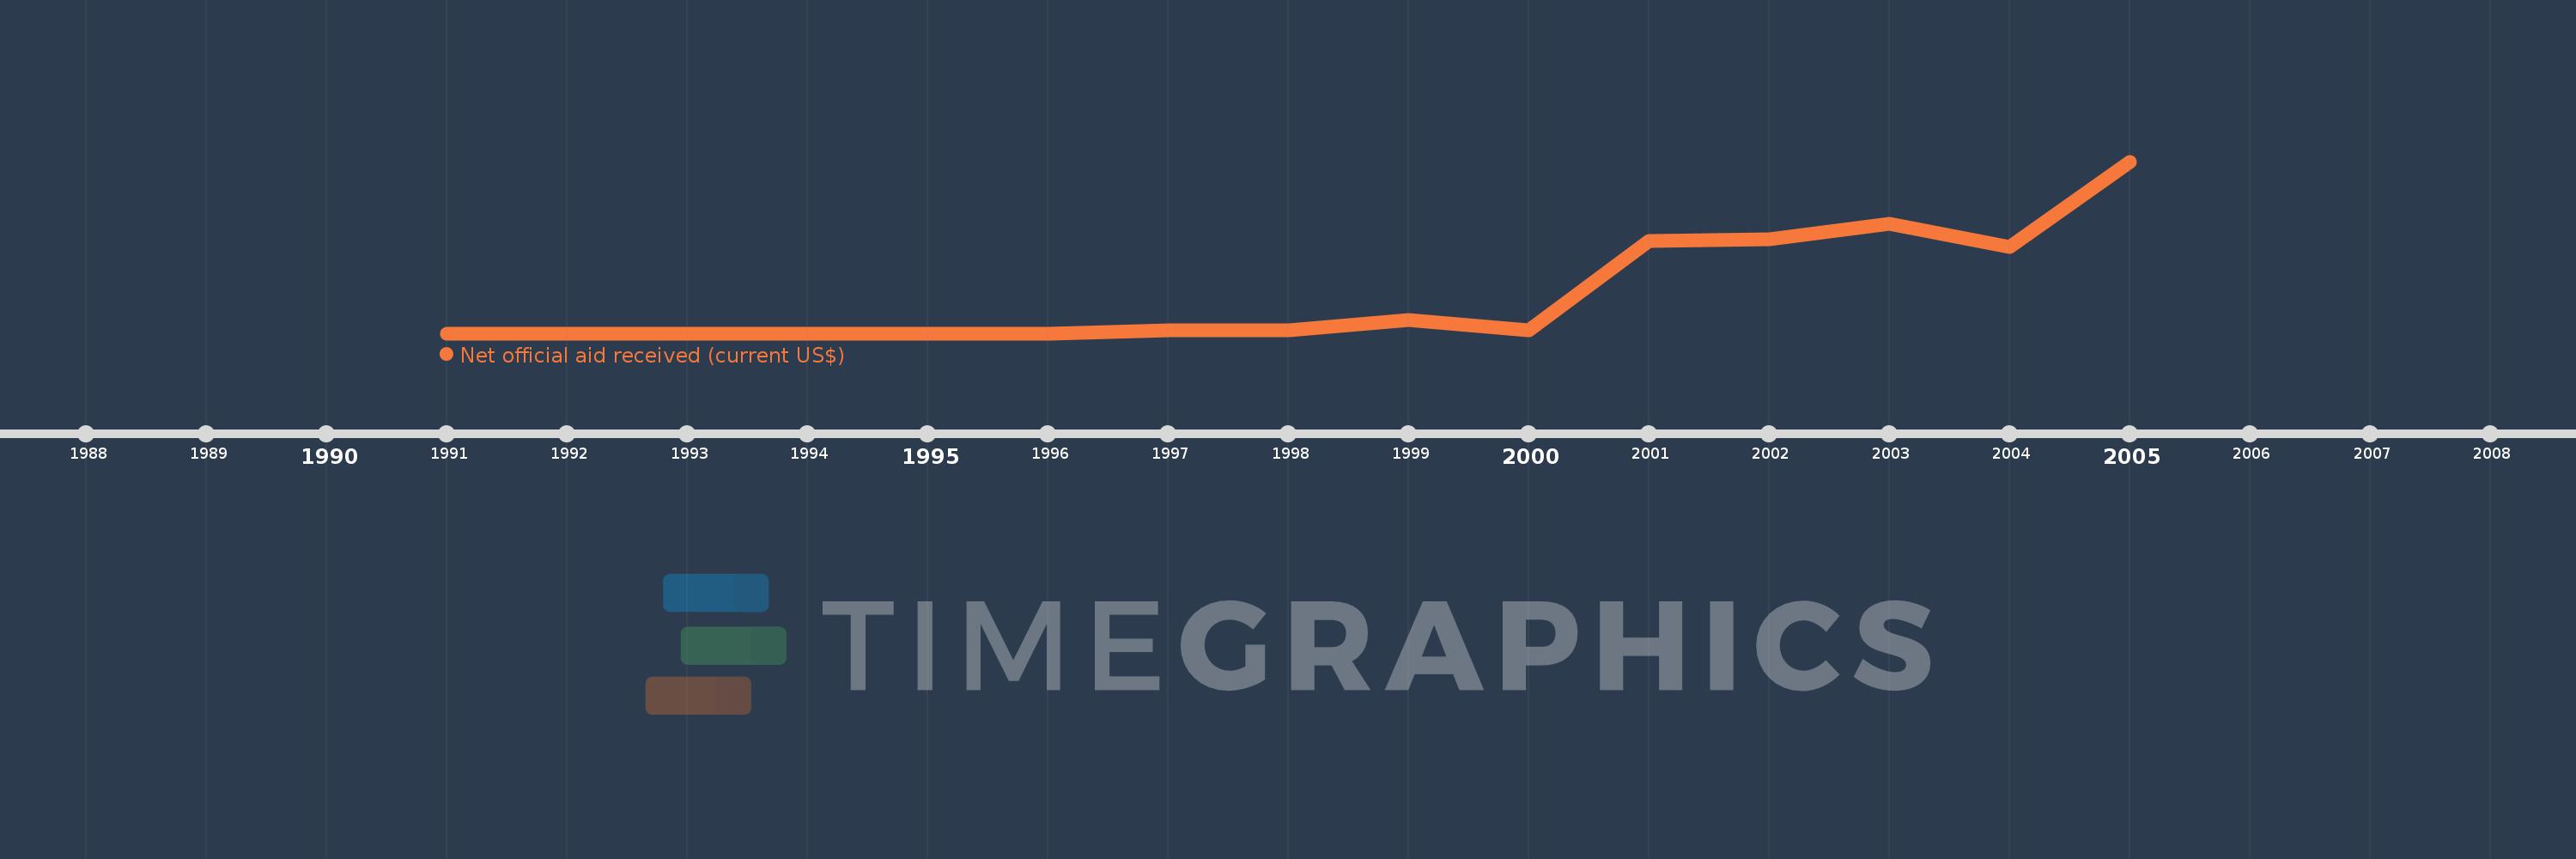
This timeline shows a graph from 1991 to 2005 of East Asia & Pacific. No data until 1990. Number of actual observations by date: 15.
Source name:
World Development Indicators
Source organization:
Development Assistance Committee of the Organisation for Economic Co-operation and Development, Geographical Distribution of Financial Flows to Developing Countries, Development Co-operation Report, and International Development Statistics database. Data are available online at: www.oecd.org/dac/stats/idsonline.
Categories, topics:
Aid Effectiveness
Last updated:
apr 23, 2017
Indicators value changes by year
Meaning:
238.239 mln
Minimum:
0.0
jan 1, 1991
Maximum:
1.067 bln
jan 1, 2005
At the date of observation
Value
Absolute change
Change from the previous value
jan 1, 1991
0.0
0.0
0.0%
jan 1, 1992
0.0
0.0
%
jan 1, 1993
0.0
0.0
%
jan 1, 1994
0.0
0.0
%
jan 1, 1995
0.0
0.0
%
jan 1, 1996
0.0
0.0
%
jan 1, 1997
18.05 mln
+18.05 mln
%
jan 1, 1998
17.29 mln
-760.0K
-4.21%
jan 1, 1999
85.25 mln
+67.96 mln
393.06%
jan 1, 2000
17.35 mln
-67.9 mln
-79.65%
jan 1, 2001
570.79 mln
+553.44 mln
3.19K%
jan 1, 2002
585.82 mln
+15.03 mln
2.63%
jan 1, 2003
677.58 mln
+91.76 mln
15.66%
jan 1, 2004
534.87 mln
-142.71 mln
-21.06%
jan 1, 2005
1.067 bln
+531.71 mln
99.41%
Ranking of countries by current statistics by years