Download This statistics in other country:
Timeline:
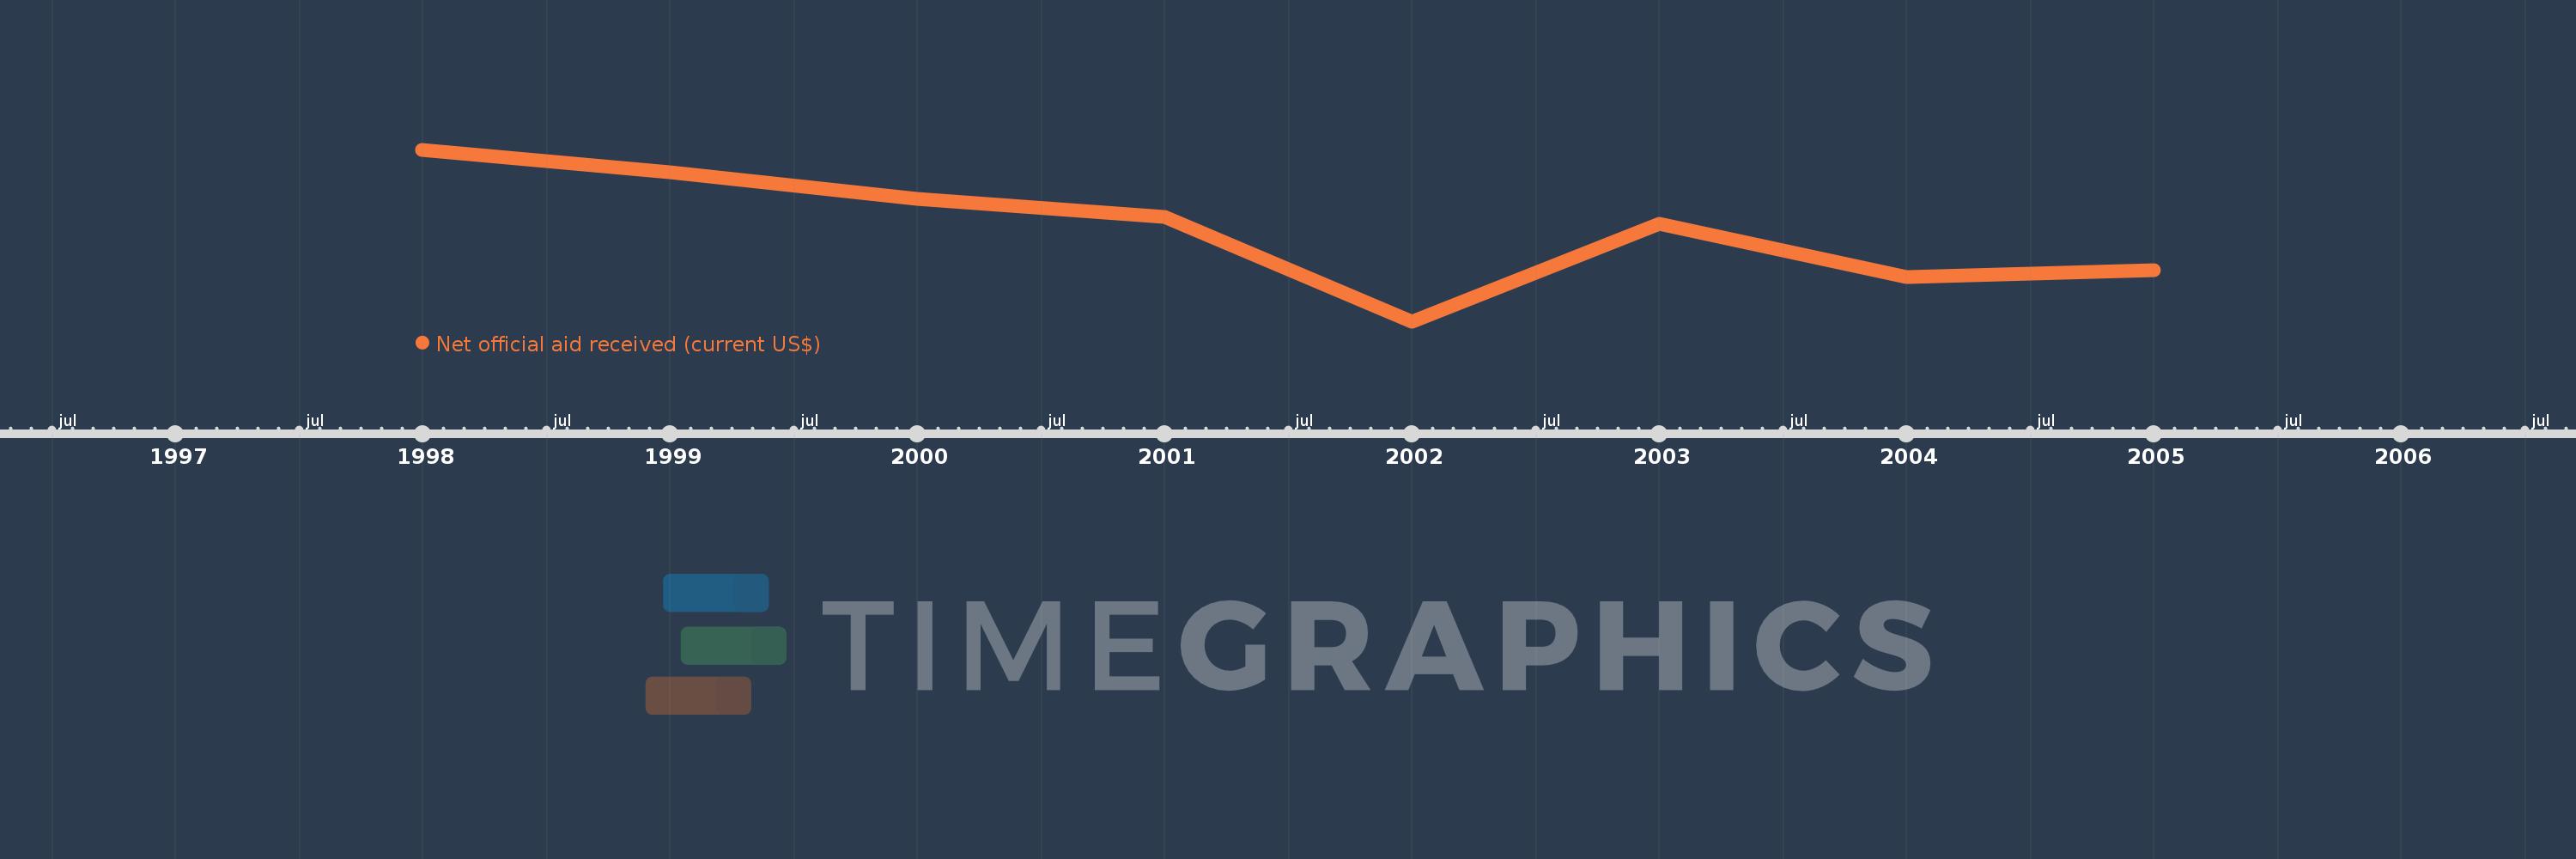
This timeline shows a graph from 1998 to 2005 of Israel. No data until 1997. Number of actual observations by date: 8.
Source name:
World Development Indicators
Source organization:
Development Assistance Committee of the Organisation for Economic Co-operation and Development, Geographical Distribution of Financial Flows to Developing Countries, Development Co-operation Report, and International Development Statistics database. Data are available online at: www.oecd.org/dac/stats/idsonline.
Categories, topics:
Aid Effectiveness
Last updated:
apr 23, 2017
Indicators value changes by year
Minimum:
172.35 mln
jan 1, 2002
Maximum:
1.196 bln
jan 1, 1998
At the date of observation
Value
Absolute change
Change from the previous value
jan 1, 1998
1.196 bln
+1.196 bln
0.0%
jan 1, 1999
1.066 bln
-130.28 mln
-10.89%
jan 1, 2000
905.71 mln
-160.36 mln
-15.04%
jan 1, 2001
800.0 mln
-105.71 mln
-11.67%
jan 1, 2002
172.35 mln
-627.65 mln
-78.46%
jan 1, 2003
756.87 mln
+584.52 mln
339.15%
jan 1, 2004
439.99 mln
-316.88 mln
-41.87%
jan 1, 2005
478.85 mln
+38.86 mln
8.83%
Ranking of countries by current statistics by years