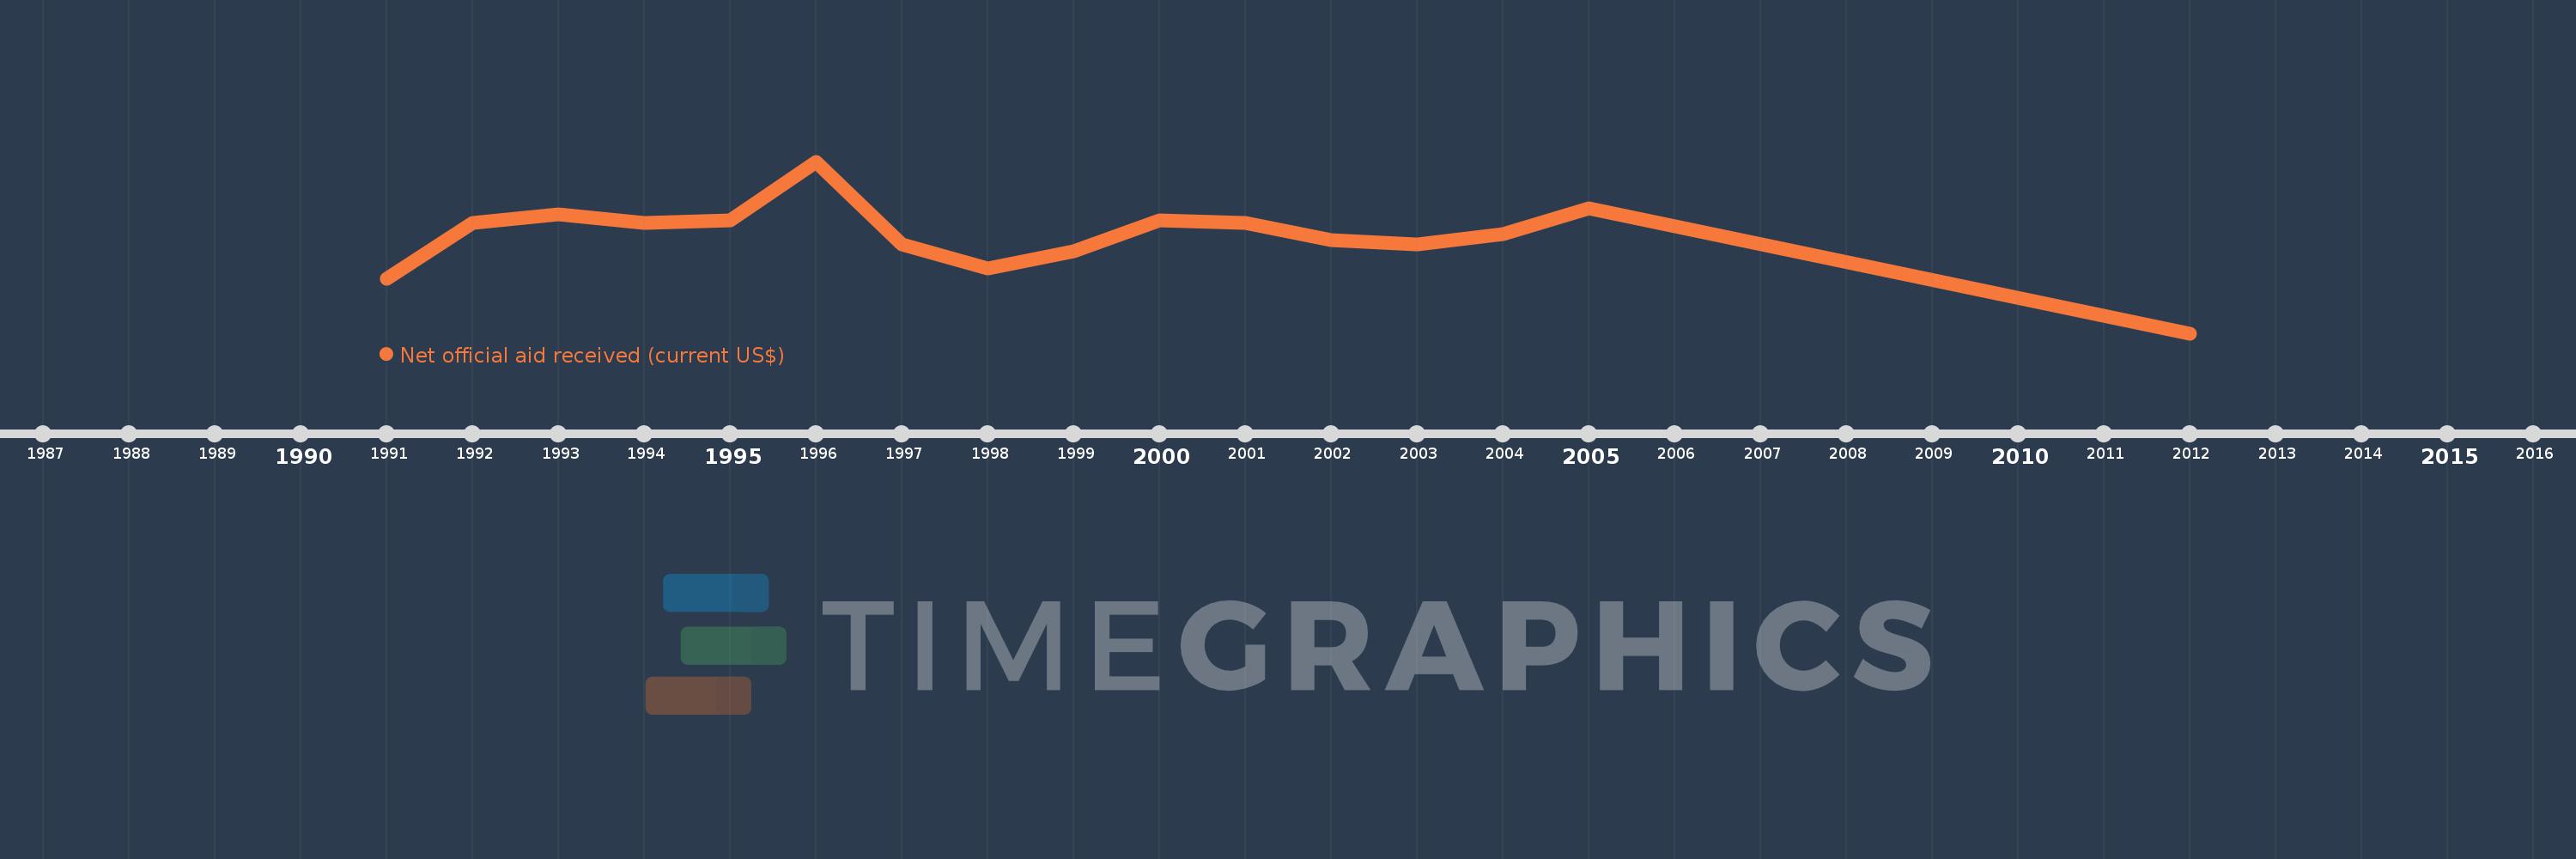
This timeline shows a graph from 1991 to 2012 of IBRD only. No data until 1990. Number of actual observations by date: 16.
Source name:
World Development Indicators
Source organization:
Development Assistance Committee of the Organisation for Economic Co-operation and Development, Geographical Distribution of Financial Flows to Developing Countries, Development Co-operation Report, and International Development Statistics database. Data are available online at: www.oecd.org/dac/stats/idsonline.
Categories, topics:
Aid Effectiveness
Last updated:
apr 23, 2017
Indicators value changes by year
Meaning:
3.742 bln
Minimum:
280.0K
jan 1, 2012
Maximum:
6.658 bln
jan 1, 1996
At the date of observation
Value
Absolute change
Change from the previous value
jan 1, 1991
2.12 bln
+2.12 bln
0.0%
jan 1, 1992
4.263 bln
+2.142 bln
101.04%
jan 1, 1993
4.606 bln
+343.74 mln
8.06%
jan 1, 1994
4.286 bln
-320.48 mln
-6.96%
jan 1, 1995
4.377 bln
+90.92 mln
2.12%
jan 1, 1996
6.658 bln
+2.281 bln
52.12%
jan 1, 1997
3.452 bln
-3.206 bln
-48.15%
jan 1, 1998
2.524 bln
-928.89 mln
-26.91%
jan 1, 1999
3.166 bln
+642.55 mln
25.46%
jan 1, 2000
4.376 bln
+1.21 bln
38.22%
jan 1, 2001
4.272 bln
-104.23 mln
-2.38%
jan 1, 2002
3.628 bln
-643.87 mln
-15.07%
jan 1, 2003
3.448 bln
-180.46 mln
-4.97%
jan 1, 2004
3.846 bln
+398.38 mln
11.56%
jan 1, 2005
4.846 bln
+1.0 bln
26.01%
jan 1, 2012
280.0K
-4.846 bln
-99.99%
Ranking of countries by current statistics by years