Download This statistics in other country:
Timeline:
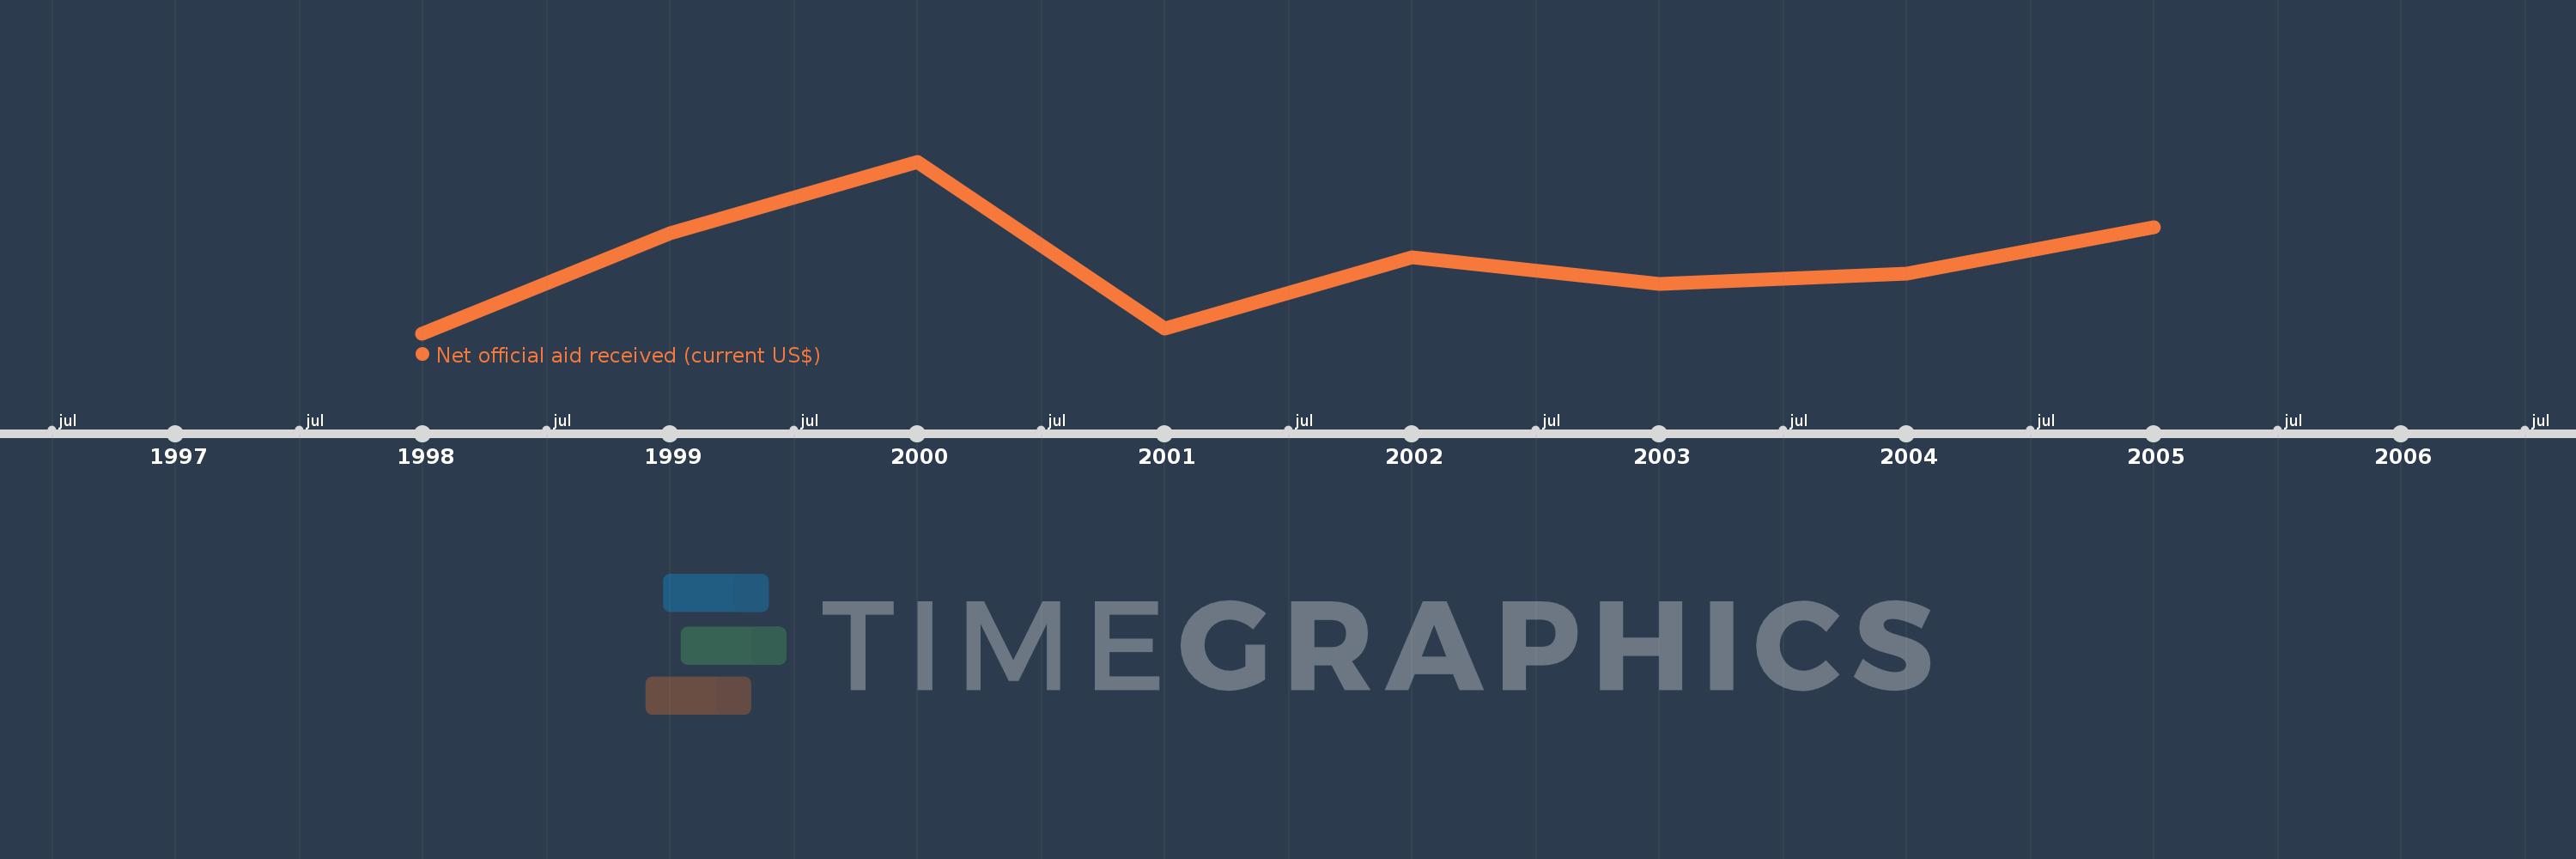
This timeline shows a graph from 1998 to 2005 of Cayman Islands. No data until 1997. Number of actual observations by date: 8.
Source name:
World Development Indicators
Source organization:
Development Assistance Committee of the Organisation for Economic Co-operation and Development, Geographical Distribution of Financial Flows to Developing Countries, Development Co-operation Report, and International Development Statistics database. Data are available online at: www.oecd.org/dac/stats/idsonline.
Categories, topics:
Aid Effectiveness
Last updated:
apr 23, 2017
Indicators value changes by year
Minimum:
-3.8 mln
jan 1, 1998
Maximum:
3.01 mln
jan 1, 2000
At the date of observation
Value
Absolute change
Change from the previous value
jan 1, 1998
-3.8 mln
-3.8 mln
0.0%
jan 1, 1999
160.0K
+3.96 mln
-104.21%
jan 1, 2000
3.01 mln
+2.85 mln
1.78K%
jan 1, 2001
-3.6 mln
-6.61 mln
-219.6%
jan 1, 2002
-780.0K
+2.82 mln
-78.33%
jan 1, 2003
-1.85 mln
-1.07 mln
137.18%
jan 1, 2004
-1.43 mln
+420.0K
-22.7%
jan 1, 2005
390.0K
+1.82 mln
-127.27%
Ranking of countries by current statistics by years