Download This statistics in other country:
Timeline:
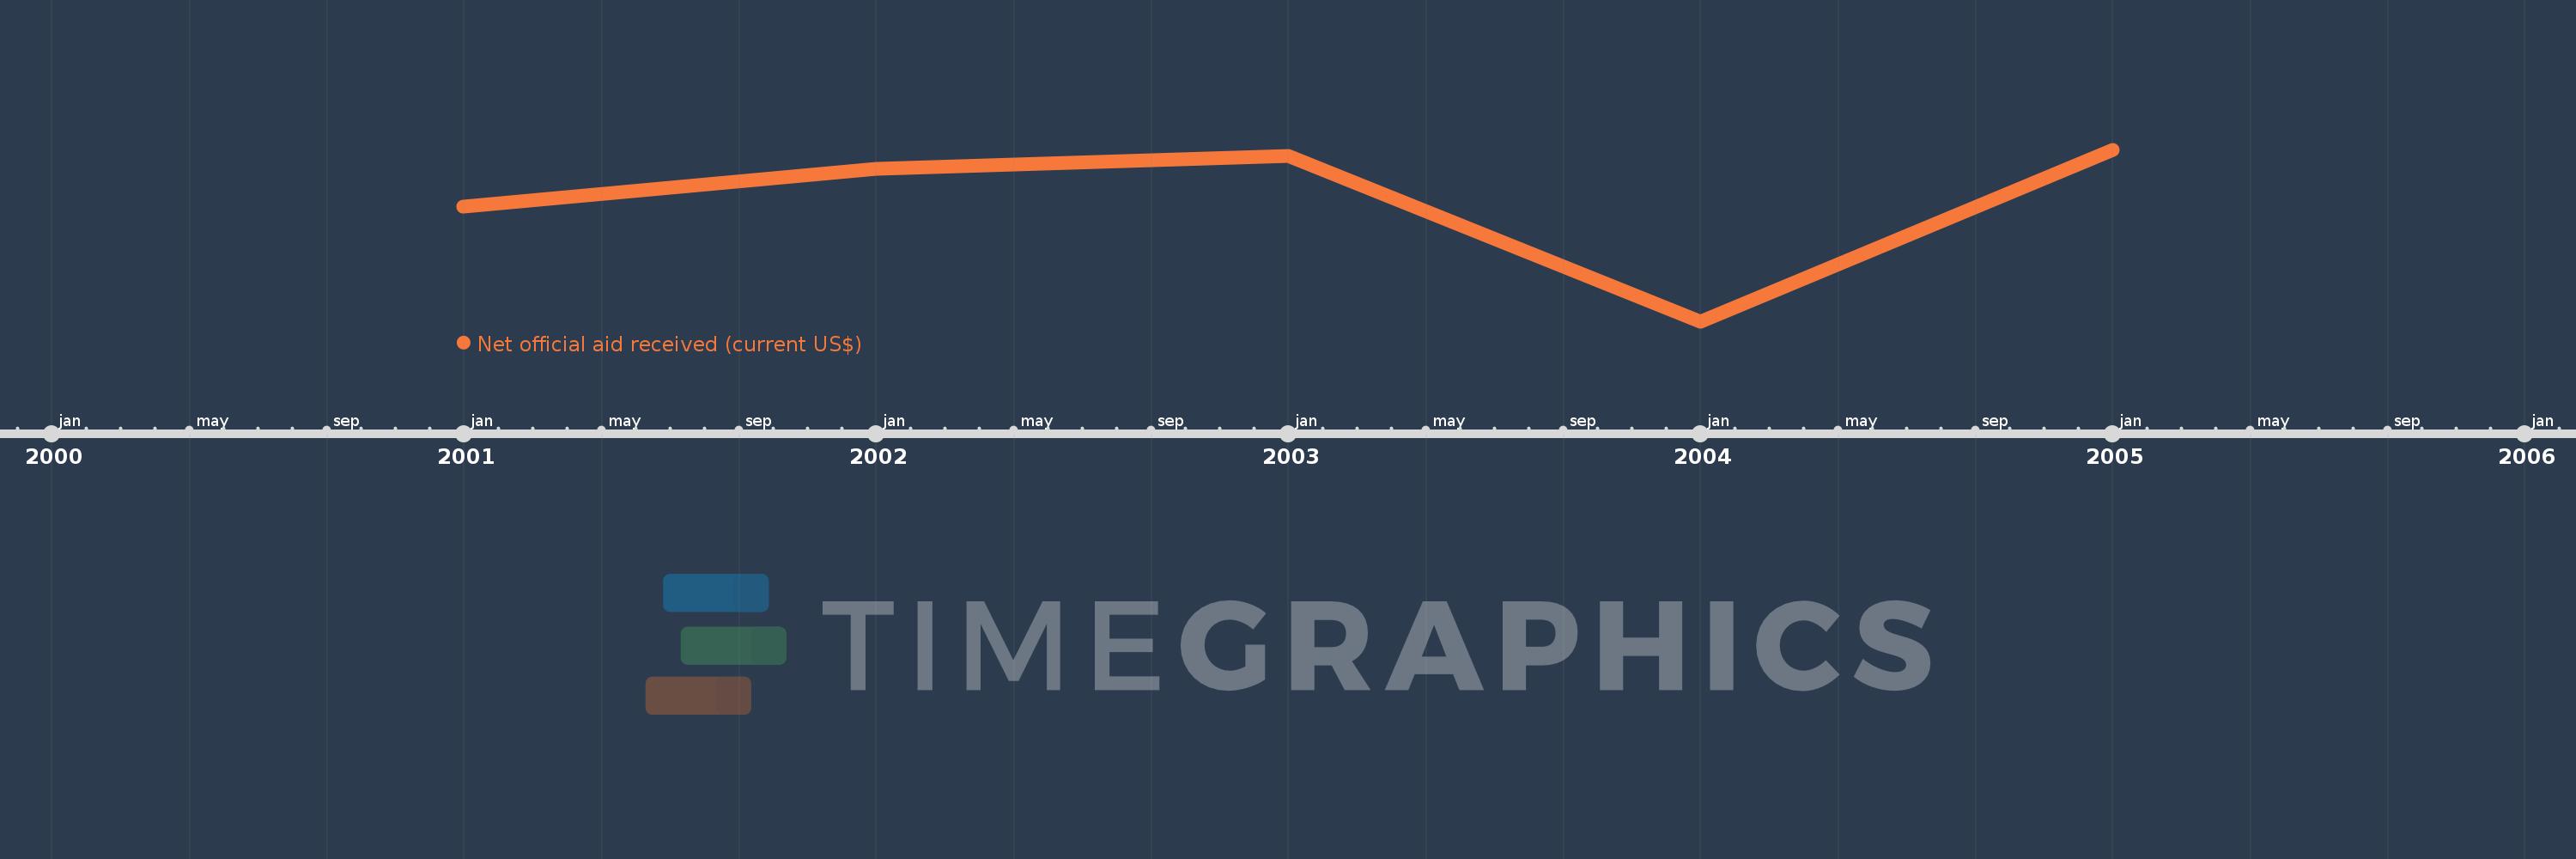
This timeline shows a graph from 2001 to 2005 of East Asia & Pacific (IDA & IBRD countries). No data until 2000. Number of actual observations by date: 5.
Source name:
World Development Indicators
Source organization:
Development Assistance Committee of the Organisation for Economic Co-operation and Development, Geographical Distribution of Financial Flows to Developing Countries, Development Co-operation Report, and International Development Statistics database. Data are available online at: www.oecd.org/dac/stats/idsonline.
Categories, topics:
Aid Effectiveness
Last updated:
apr 23, 2017
Indicators value changes by year
Minimum:
-461.6 mln
jan 1, 2004
Maximum:
-69.07 mln
jan 1, 2005
At the date of observation
Value
Absolute change
Change from the previous value
jan 1, 2001
-198.14 mln
-198.14 mln
0.0%
jan 1, 2002
-111.33 mln
+86.81 mln
-43.81%
jan 1, 2003
-81.91 mln
+29.42 mln
-26.43%
jan 1, 2004
-461.6 mln
-379.69 mln
463.55%
jan 1, 2005
-69.07 mln
+392.53 mln
-85.04%
Ranking of countries by current statistics by years