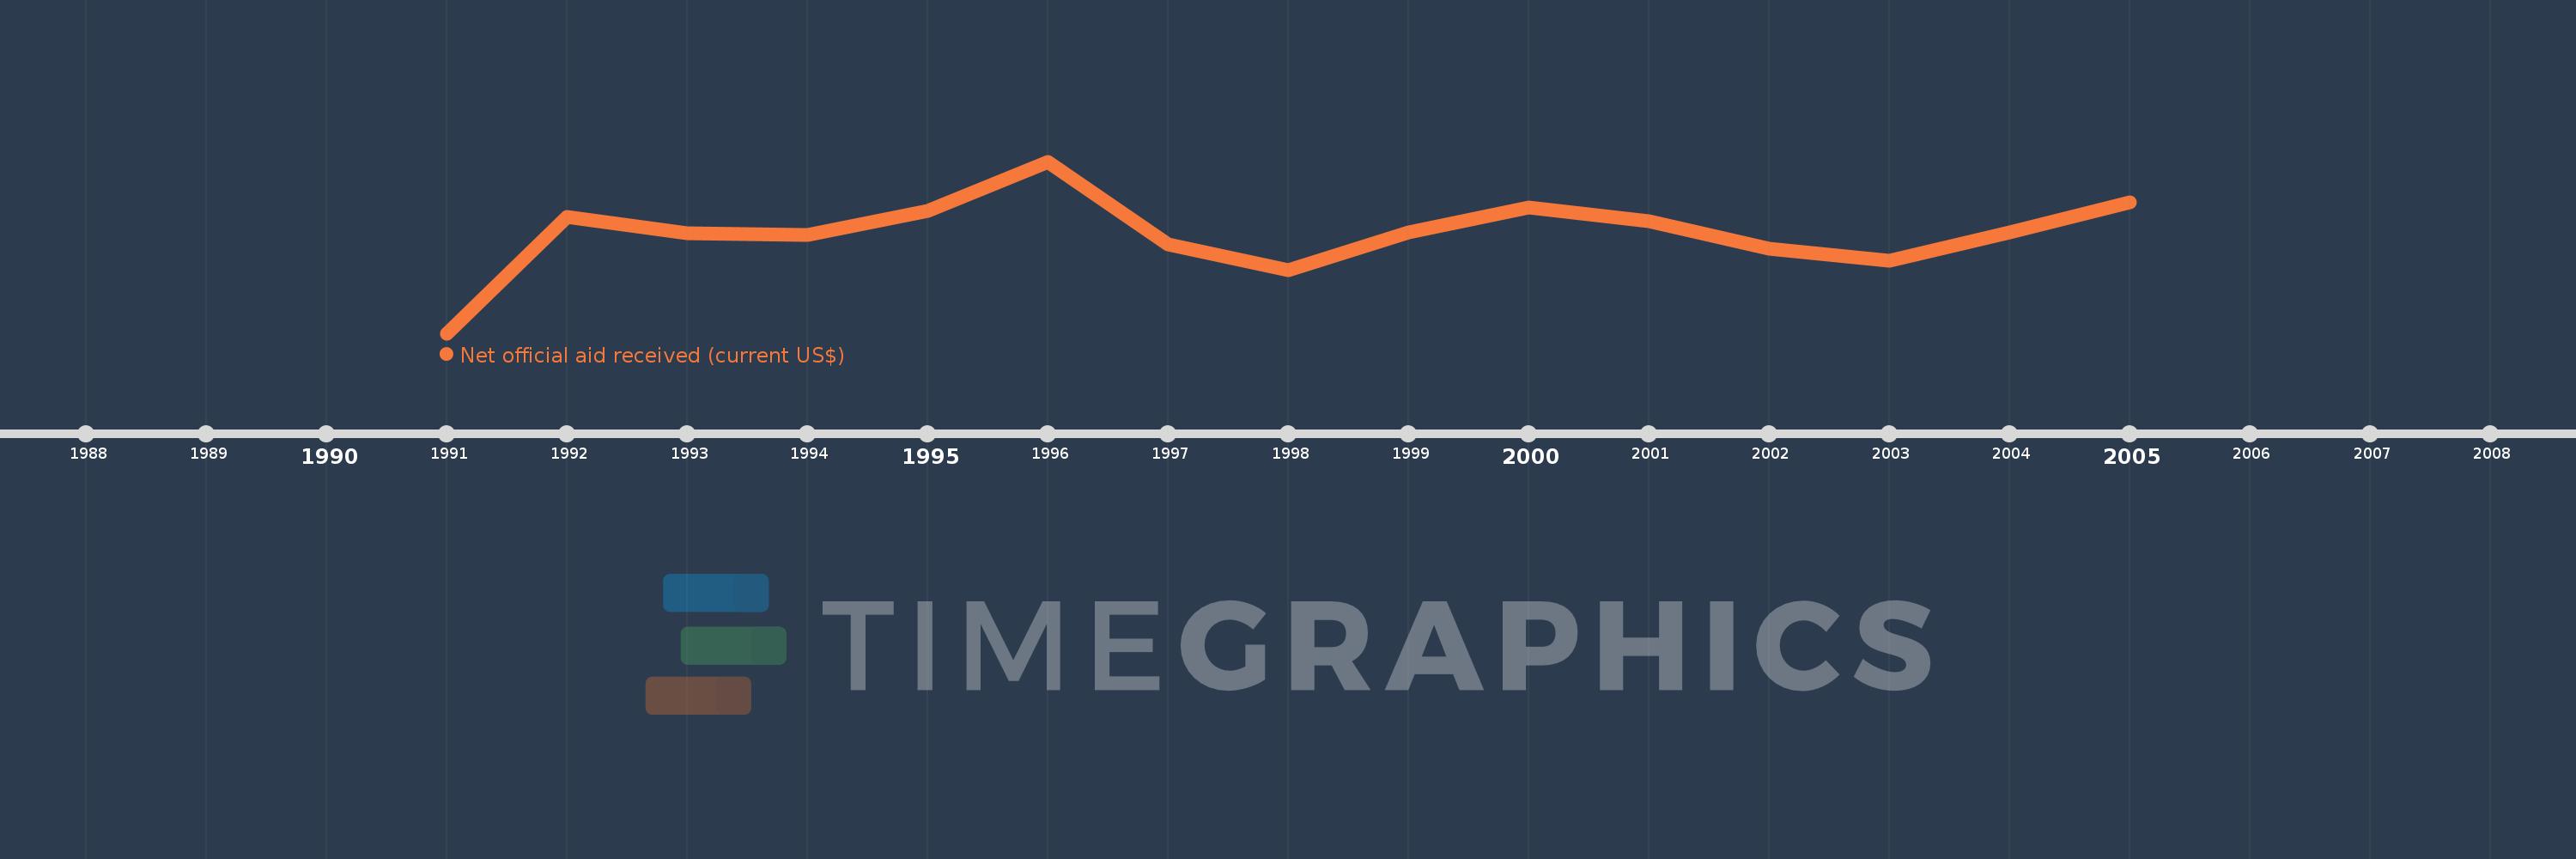
This timeline shows a graph from 1991 to 2005 of Europe & Central Asia. No data until 1990. Number of actual observations by date: 15.
Source name:
World Development Indicators
Source organization:
Development Assistance Committee of the Organisation for Economic Co-operation and Development, Geographical Distribution of Financial Flows to Developing Countries, Development Co-operation Report, and International Development Statistics database. Data are available online at: www.oecd.org/dac/stats/idsonline.
Categories, topics:
Aid Effectiveness
Last updated:
apr 23, 2017
Indicators value changes by year
Meaning:
6.017 bln
Minimum:
2.288 bln
jan 1, 1991
Maximum:
8.741 bln
jan 1, 1996
At the date of observation
Value
Absolute change
Change from the previous value
jan 1, 1991
2.288 bln
+2.288 bln
0.0%
jan 1, 1992
6.644 bln
+4.356 bln
190.44%
jan 1, 1993
6.048 bln
-596.2 mln
-8.97%
jan 1, 1994
5.989 bln
-58.51 mln
-0.97%
jan 1, 1995
6.873 bln
+883.65 mln
14.75%
jan 1, 1996
8.741 bln
+1.868 bln
27.17%
jan 1, 1997
5.615 bln
-3.125 bln
-35.75%
jan 1, 1998
4.649 bln
-966.09 mln
-17.2%
jan 1, 1999
6.079 bln
+1.43 bln
30.76%
jan 1, 2000
7.03 bln
+950.89 mln
15.64%
jan 1, 2001
6.512 bln
-518.86 mln
-7.38%
jan 1, 2002
5.465 bln
-1.046 bln
-16.07%
jan 1, 2003
5.025 bln
-440.76 mln
-8.06%
jan 1, 2004
6.083 bln
+1.058 bln
21.07%
jan 1, 2005
7.213 bln
+1.13 bln
18.58%
Ranking of countries by current statistics by years