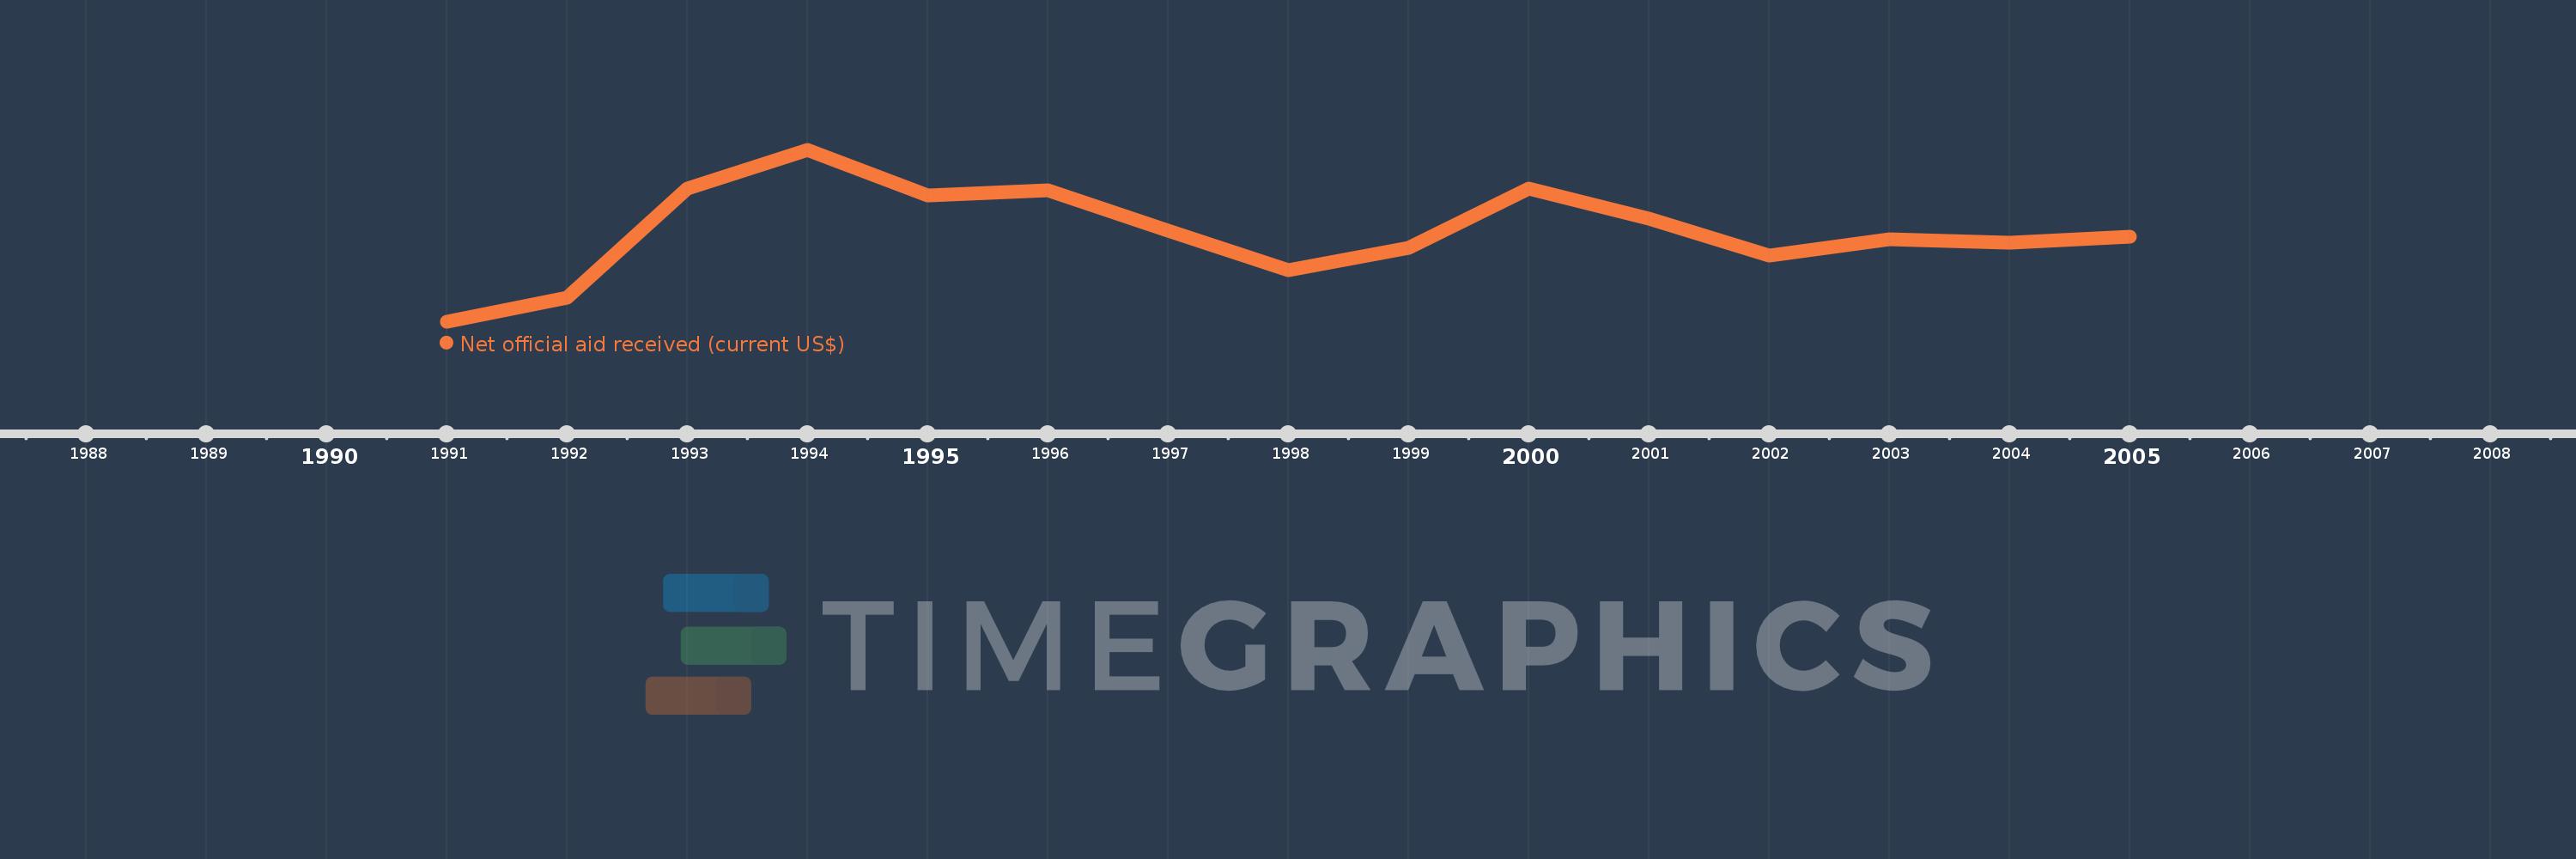
This timeline shows a graph from 1991 to 2005 of Russian Federation. No data until 1990. Number of actual observations by date: 15.
Source name:
World Development Indicators
Source organization:
Development Assistance Committee of the Organisation for Economic Co-operation and Development, Geographical Distribution of Financial Flows to Developing Countries, Development Co-operation Report, and International Development Statistics database. Data are available online at: www.oecd.org/dac/stats/idsonline.
Categories, topics:
Aid Effectiveness
Last updated:
apr 23, 2017
Indicators value changes by year
Meaning:
1.392 bln
Minimum:
254.02 mln
jan 1, 1991
Maximum:
2.419 bln
jan 1, 1994
At the date of observation
Value
Absolute change
Change from the previous value
jan 1, 1991
254.02 mln
+254.02 mln
0.0%
jan 1, 1992
563.71 mln
+309.69 mln
121.92%
jan 1, 1993
1.935 bln
+1.371 bln
243.28%
jan 1, 1994
2.419 bln
+484.3 mln
25.03%
jan 1, 1995
1.847 bln
-572.51 mln
-23.66%
jan 1, 1996
1.917 bln
+69.89 mln
3.78%
jan 1, 1997
1.403 bln
-513.63 mln
-26.8%
jan 1, 1998
903.01 mln
-500.14 mln
-35.64%
jan 1, 1999
1.183 bln
+280.11 mln
31.02%
jan 1, 2000
1.937 bln
+754.2 mln
63.75%
jan 1, 2001
1.554 bln
-383.6 mln
-19.8%
jan 1, 2002
1.092 bln
-461.55 mln
-29.71%
jan 1, 2003
1.292 bln
+200.29 mln
18.34%
jan 1, 2004
1.254 bln
-38.0 mln
-2.94%
jan 1, 2005
1.331 bln
+76.58 mln
6.1%
Ranking of countries by current statistics by years