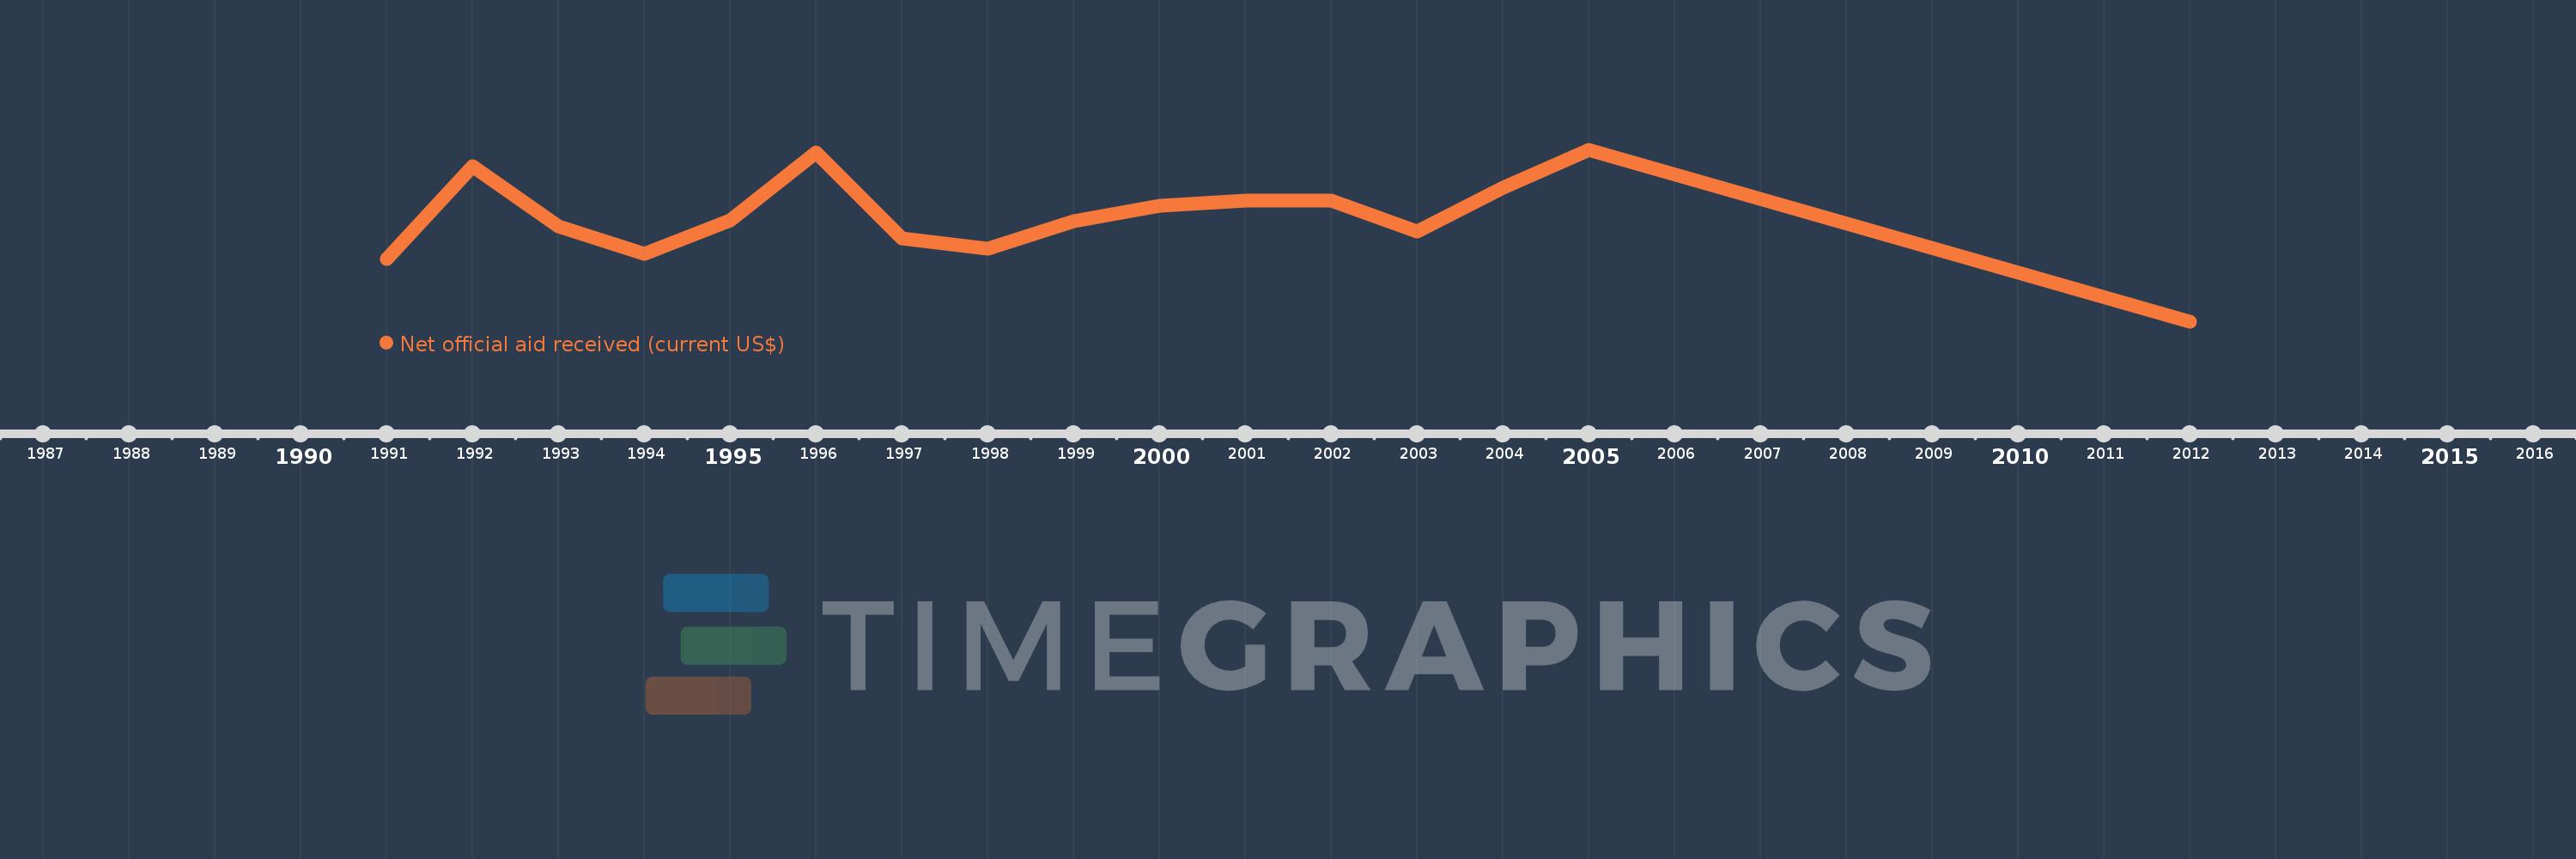
This timeline shows a graph from 1991 to 2012 of European Union. No data until 1990. Number of actual observations by date: 16.
Source name:
World Development Indicators
Source organization:
Development Assistance Committee of the Organisation for Economic Co-operation and Development, Geographical Distribution of Financial Flows to Developing Countries, Development Co-operation Report, and International Development Statistics database. Data are available online at: www.oecd.org/dac/stats/idsonline.
Categories, topics:
Aid Effectiveness
Last updated:
apr 23, 2017
Indicators value changes by year
Meaning:
2.77 bln
Minimum:
280.0K
jan 1, 2012
Maximum:
4.572 bln
jan 1, 2005
At the date of observation
Value
Absolute change
Change from the previous value
jan 1, 1991
1.665 bln
+1.665 bln
0.0%
jan 1, 1992
4.138 bln
+2.474 bln
148.58%
jan 1, 1993
2.534 bln
-1.604 bln
-38.77%
jan 1, 1994
1.805 bln
-729.32 mln
-28.78%
jan 1, 1995
2.715 bln
+910.22 mln
50.43%
jan 1, 1996
4.5 bln
+1.785 bln
65.76%
jan 1, 1997
2.226 bln
-2.274 bln
-50.53%
jan 1, 1998
1.953 bln
-273.47 mln
-12.28%
jan 1, 1999
2.675 bln
+722.19 mln
36.98%
jan 1, 2000
3.086 bln
+410.65 mln
15.35%
jan 1, 2001
3.24 bln
+154.65 mln
5.01%
jan 1, 2002
3.241 bln
+770.0K
0.02%
jan 1, 2003
2.406 bln
-834.84 mln
-25.76%
jan 1, 2004
3.568 bln
+1.162 bln
48.28%
jan 1, 2005
4.572 bln
+1.004 bln
28.13%
jan 1, 2012
280.0K
-4.571 bln
-99.99%
Ranking of countries by current statistics by years