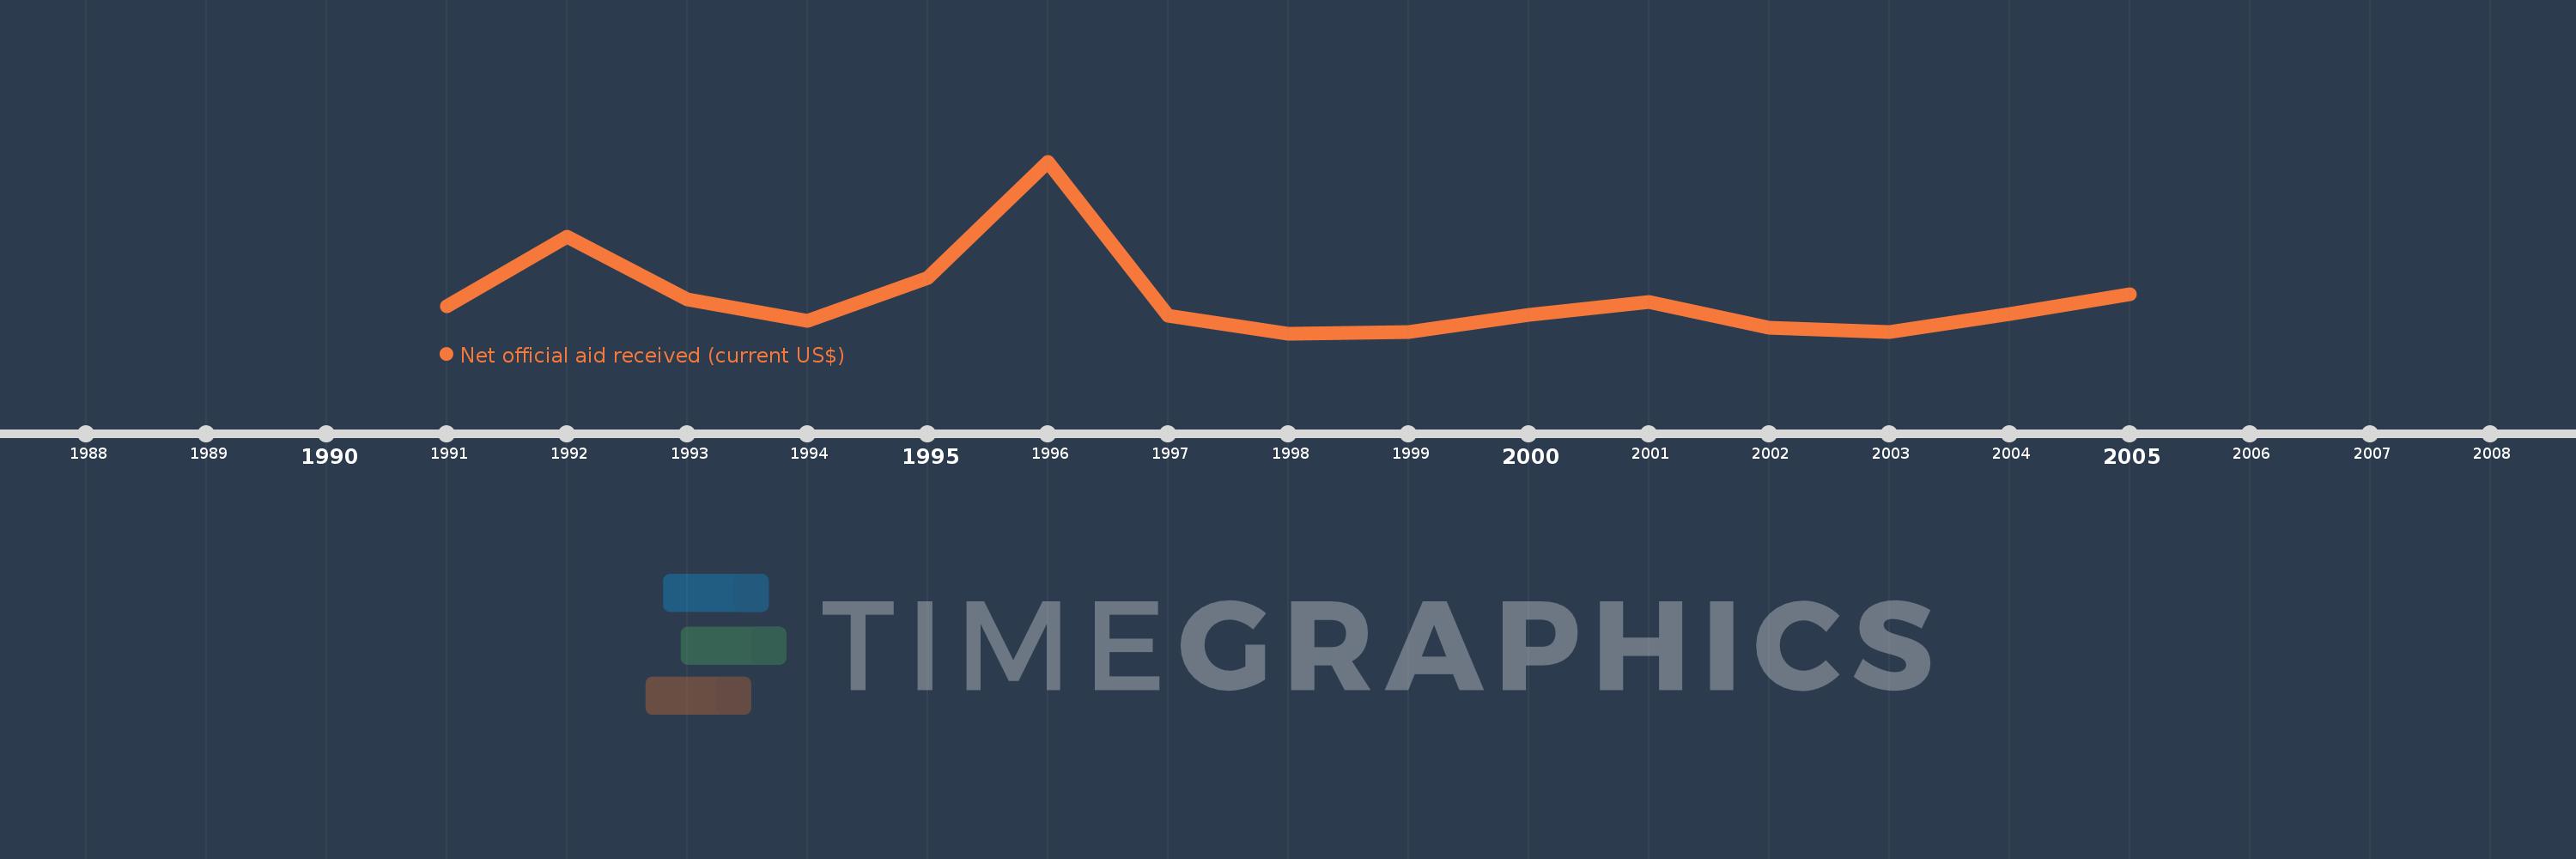
This timeline shows a graph from 1991 to 2005 of Poland. No data until 1990. Number of actual observations by date: 15.
Source name:
World Development Indicators
Source organization:
Development Assistance Committee of the Organisation for Economic Co-operation and Development, Geographical Distribution of Financial Flows to Developing Countries, Development Co-operation Report, and International Development Statistics database. Data are available online at: www.oecd.org/dac/stats/idsonline.
Categories, topics:
Aid Effectiveness
Last updated:
apr 23, 2017
Indicators value changes by year
Meaning:
1.464 bln
Minimum:
860.48 mln
jan 1, 1998
Maximum:
3.789 bln
jan 1, 1996
At the date of observation
Value
Absolute change
Change from the previous value
jan 1, 1991
1.32 bln
+1.32 bln
0.0%
jan 1, 1992
2.507 bln
+1.187 bln
89.9%
jan 1, 1993
1.436 bln
-1.072 bln
-42.75%
jan 1, 1994
1.072 bln
-363.97 mln
-25.35%
jan 1, 1995
1.81 bln
+737.96 mln
68.87%
jan 1, 1996
3.789 bln
+1.979 bln
109.39%
jan 1, 1997
1.164 bln
-2.625 bln
-69.27%
jan 1, 1998
860.48 mln
-303.89 mln
-26.1%
jan 1, 1999
875.33 mln
+14.85 mln
1.73%
jan 1, 2000
1.179 bln
+303.82 mln
34.71%
jan 1, 2001
1.393 bln
+214.26 mln
18.17%
jan 1, 2002
960.47 mln
-432.94 mln
-31.07%
jan 1, 2003
882.13 mln
-78.34 mln
-8.16%
jan 1, 2004
1.186 bln
+303.71 mln
34.43%
jan 1, 2005
1.522 bln
+336.31 mln
28.36%
Ranking of countries by current statistics by years