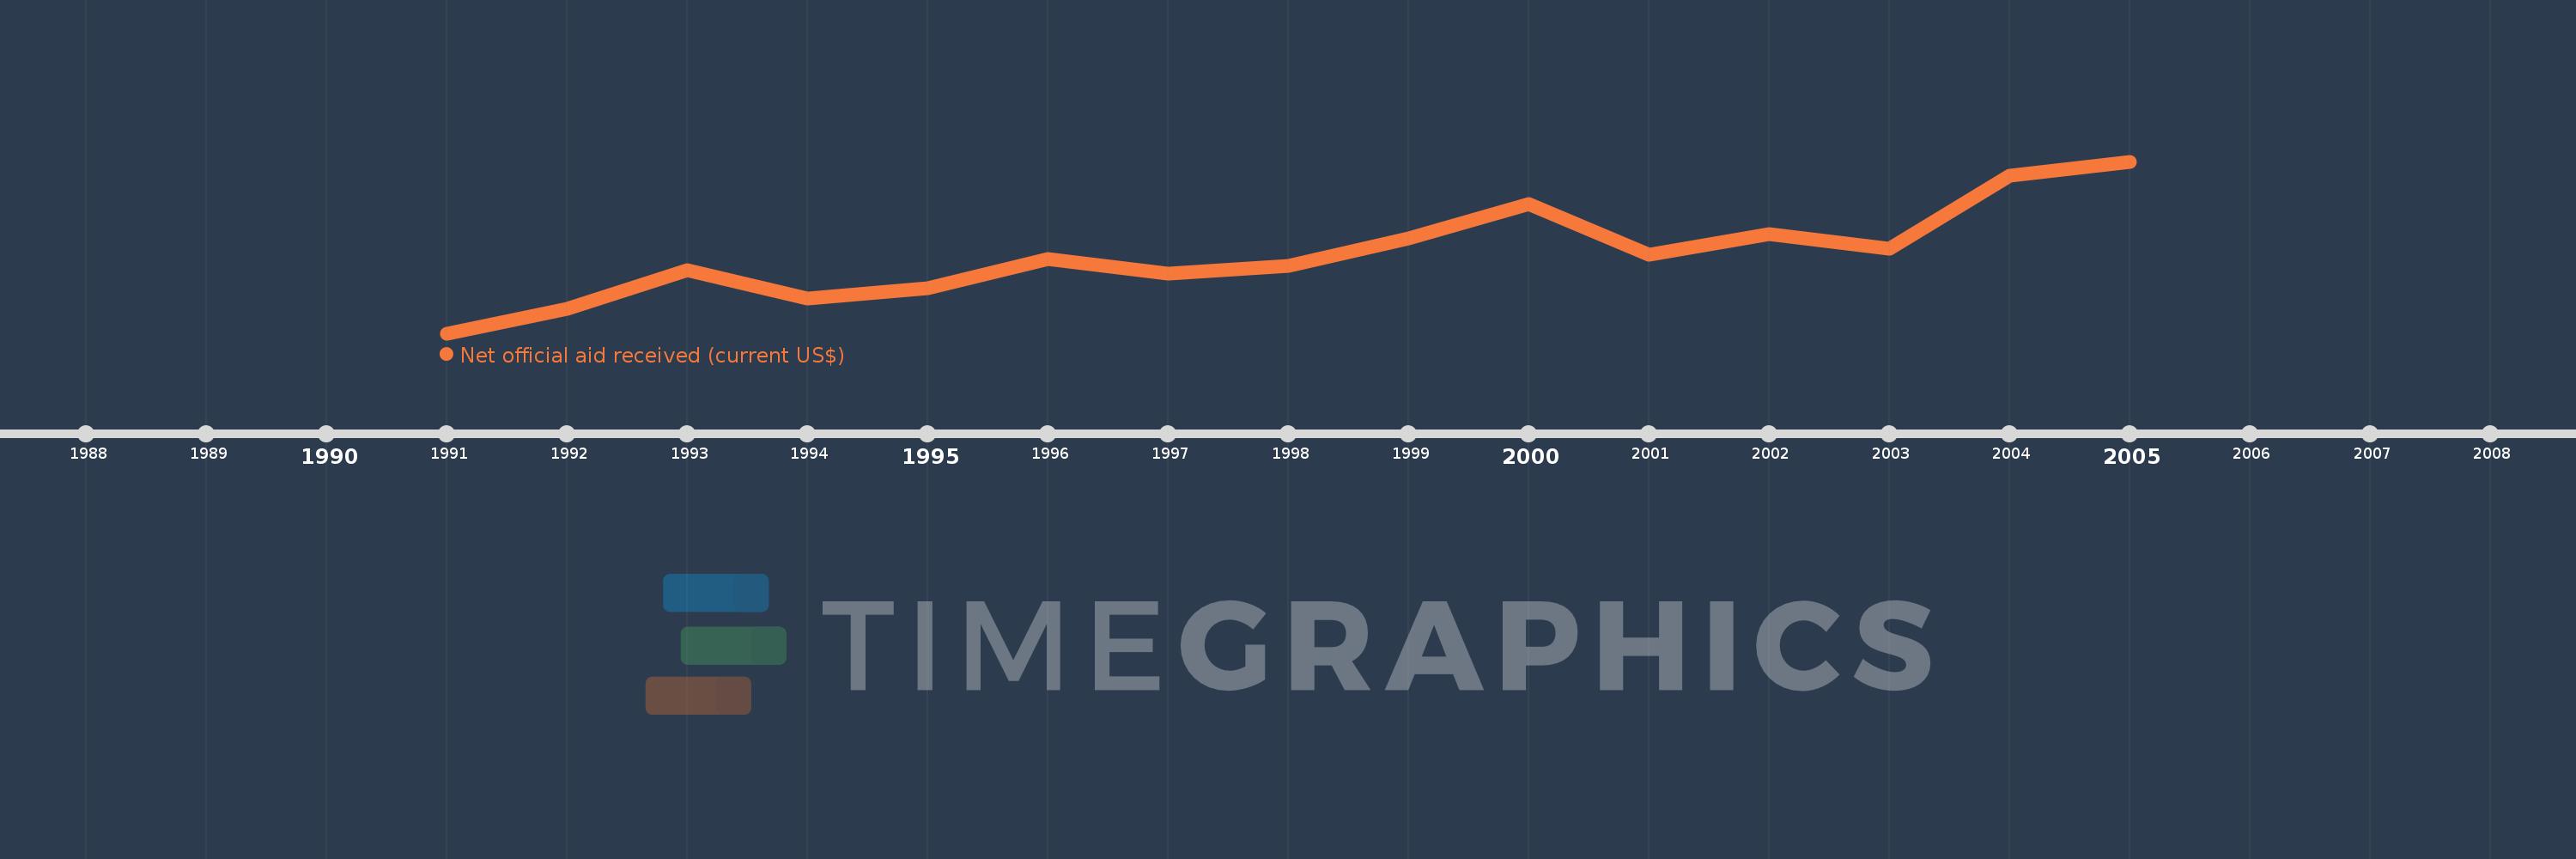
This timeline shows a graph from 1991 to 2005 of Euro area. No data until 1990. Number of actual observations by date: 15.
Source name:
World Development Indicators
Source organization:
Development Assistance Committee of the Organisation for Economic Co-operation and Development, Geographical Distribution of Financial Flows to Developing Countries, Development Co-operation Report, and International Development Statistics database. Data are available online at: www.oecd.org/dac/stats/idsonline.
Categories, topics:
Aid Effectiveness
Last updated:
apr 23, 2017
Indicators value changes by year
Meaning:
423.155 mln
Minimum:
6.84 mln
jan 1, 1991
Maximum:
913.28 mln
jan 1, 2005
At the date of observation
Value
Absolute change
Change from the previous value
jan 1, 1991
6.84 mln
+6.84 mln
0.0%
jan 1, 1992
137.45 mln
+130.61 mln
1.91K%
jan 1, 1993
341.89 mln
+204.44 mln
148.74%
jan 1, 1994
188.34 mln
-153.55 mln
-44.91%
jan 1, 1995
246.39 mln
+58.05 mln
30.82%
jan 1, 1996
398.49 mln
+152.1 mln
61.73%
jan 1, 1997
319.87 mln
-78.62 mln
-19.73%
jan 1, 1998
363.33 mln
+43.46 mln
13.59%
jan 1, 1999
508.36 mln
+145.03 mln
39.92%
jan 1, 2000
686.97 mln
+178.61 mln
35.13%
jan 1, 2001
419.63 mln
-267.34 mln
-38.92%
jan 1, 2002
528.89 mln
+109.26 mln
26.04%
jan 1, 2003
451.19 mln
-77.7 mln
-14.69%
jan 1, 2004
836.41 mln
+385.22 mln
85.38%
jan 1, 2005
913.28 mln
+76.87 mln
9.19%
Ranking of countries by current statistics by years