29
/
en
AIzaSyAYiBZKx7MnpbEhh9jyipgxe19OcubqV5w
April 1, 2024
98673
Cambodia
KHM
true
2
1
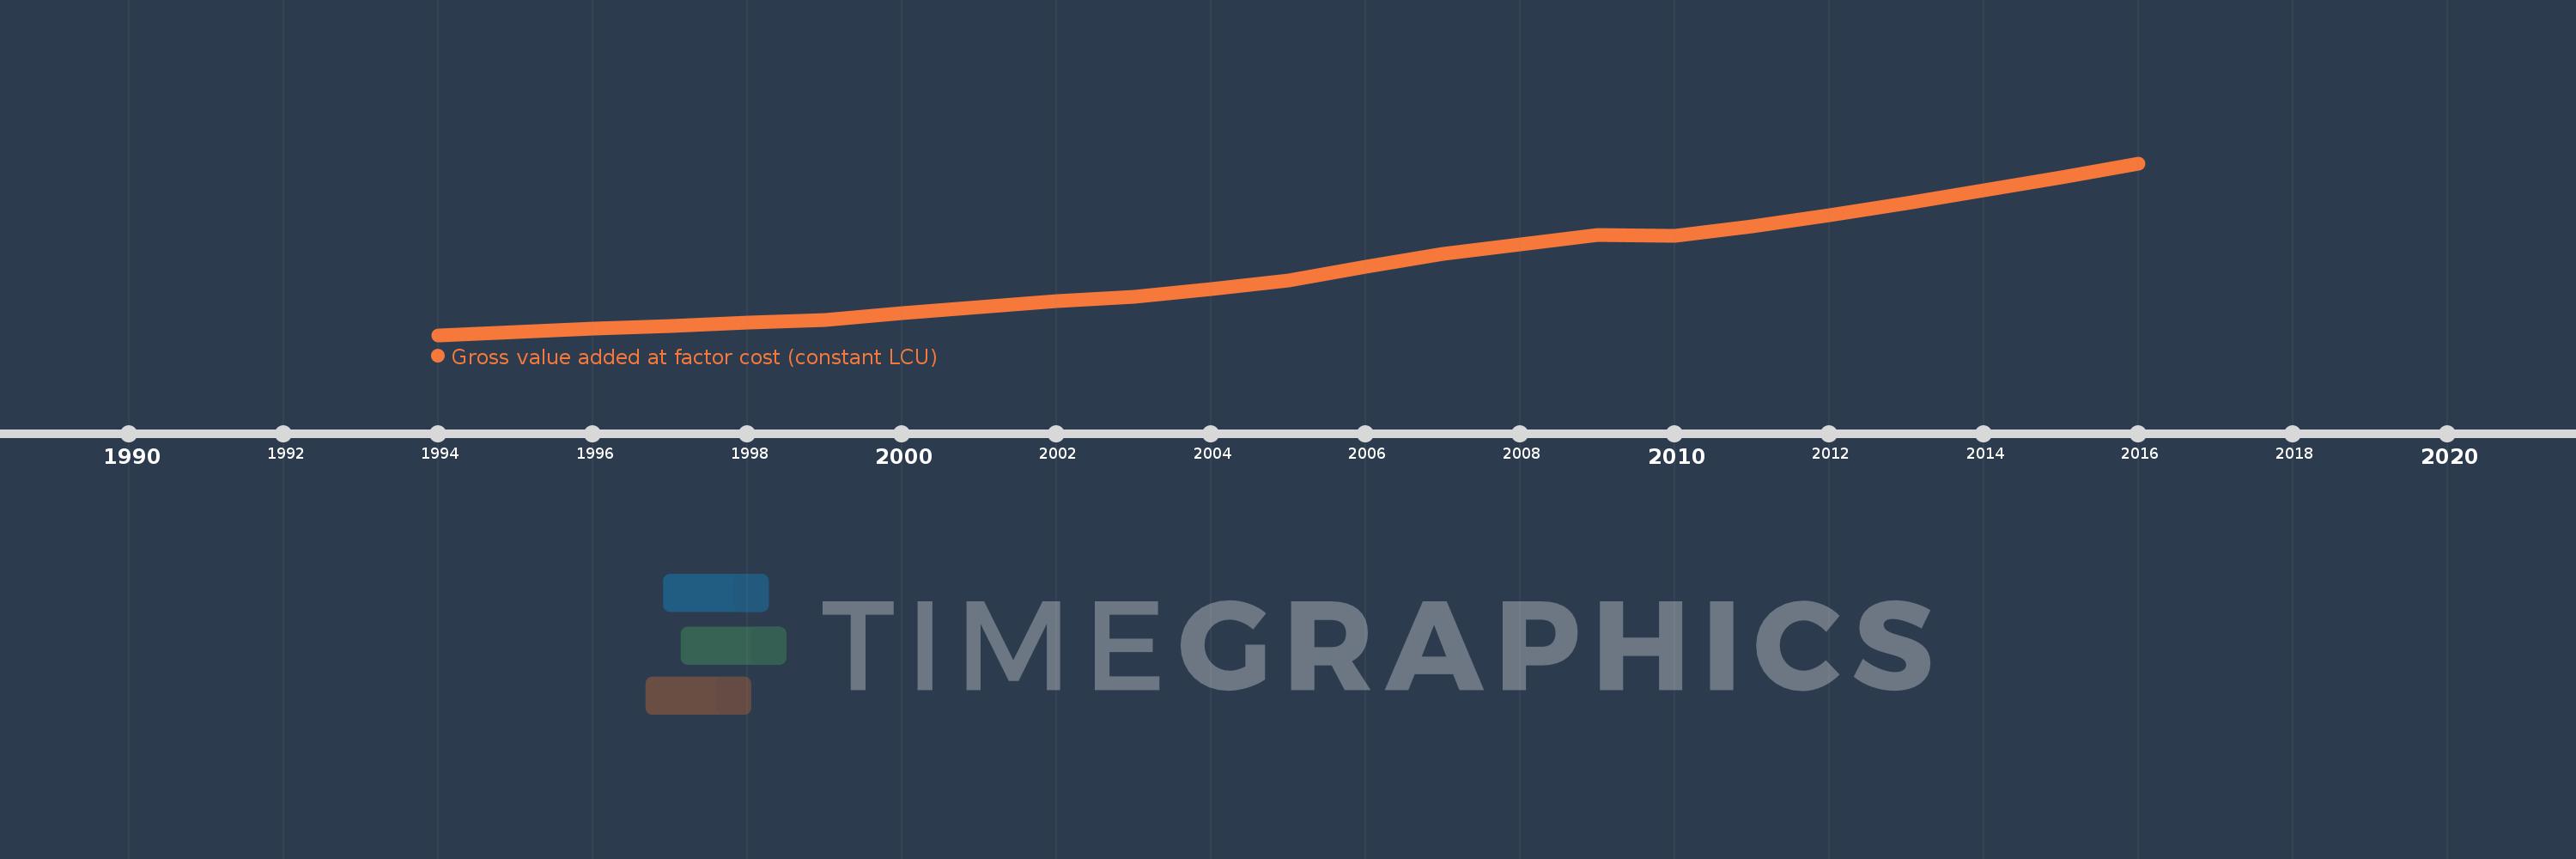
Gross value added at factor cost (constant LCU)
2016,2015,2014,2013,2012,2011,2010,2009,2008,2007,2006,2005,2004,2003,2002,2001,2000,1999,1998,1997,1996,1995,1994
This statistics in other country:
AfghanistanAlbaniaAlgeriaAntigua and BarbudaArgentinaArmeniaAustraliaAustriaAzerbaijanBahamas, TheBangladeshBelarusBelgiumBelizeBeninBermudaBhutanBoliviaBosnia and HerzegovinaBotswanaBrazilBulgariaBurkina FasoBurundiCabo VerdeCambodiaCameroonCanadaCayman IslandsCentral African RepublicChadChileColombiaCongo, Dem. Rep.Costa RicaCote d'IvoireCroatiaCubaCyprusCzech RepublicDenmarkDjiboutiDominicaDominican RepublicEcuadorEgypt, Arab Rep.El SalvadorEquatorial GuineaEritreaEstoniaEthiopiaFijiFinlandFranceGabonGambia, TheGeorgiaGermanyGhanaGreeceGrenadaGuatemalaGuineaGuinea-BissauGuyanaHaitiHondurasHong Kong SAR, ChinaHungaryIcelandIndiaIndonesiaIran, Islamic Rep.IrelandItalyJamaicaJapanJordanKazakhstanKenyaKiribatiKorea, Rep.KosovoKuwaitKyrgyz RepublicLao PDRLatviaLebanonLesothoLiberiaLithuaniaLuxembourgMacedonia, FYRMadagascarMalawiMaldivesMaliMarshall IslandsMauritaniaMauritiusMexicoMicronesia, Fed. Sts.MoldovaMongoliaMontenegroMoroccoMozambiqueNamibiaNepalNetherlandsNew ZealandNicaraguaNigeriaNorwayOmanPakistanPalauPanamaPapua New GuineaParaguayPeruPhilippinesPolandPortugalRomaniaRussian FederationRwandaSao Tome and PrincipeSenegalSerbiaSeychellesSierra LeoneSingaporeSlovak RepublicSloveniaSolomon IslandsSomaliaSouth AfricaSpainSri LankaSt. Kitts and NevisSt. LuciaSt. Vincent and the GrenadinesSudanSurinameSwazilandSwedenSwitzerlandSyrian Arab RepublicTajikistanTanzaniaThailandTimor-LesteTongaTrinidad and TobagoTunisiaTurkeyTurkmenistanTuvaluUgandaUkraineUnited Arab EmiratesUnited KingdomUnited StatesUruguayUzbekistanVanuatuVenezuela, RBVietnamWest Bank and GazaZambiaZimbabwe Timeline:
This timeline shows a graph from 1994 to 2016 of Cambodia. No data until 1993. Number of actual observations by date: 23.
Source name:
World Development Indicators
Source organization:
World Bank national accounts data, and OECD National Accounts data files.
Categories, topics:
Economy & Growth
Last updated:
apr 23, 2017
Indicators value changes by year
Minimum:
8.262 trl
jan 1, 1994
Maximum:
39.934 trl
jan 1, 2016
At the date of observation
Value
Absolute change
Change from previous value
jan 1, 1994
8.262 trl
+8.262 trl
0.0%
jan 1, 1995
8.818 trl
+555.823 bln
6.73%
jan 1, 1996
9.47 trl
+652.044 bln
7.39%
jan 1, 1997
9.92 trl
+449.963 bln
4.75%
jan 1, 1998
10.54 trl
+619.276 bln
6.24%
jan 1, 1999
11.096 trl
+556.015 bln
5.28%
jan 1, 2000
12.228 trl
+1.133 trl
10.21%
jan 1, 2001
13.367 trl
+1.139 trl
9.31%
jan 1, 2002
14.457 trl
+1.09 trl
8.16%
jan 1, 2003
15.374 trl
+916.382 bln
6.34%
jan 1, 2004
16.762 trl
+1.388 trl
9.03%
jan 1, 2005
18.333 trl
+1.571 trl
9.37%
jan 1, 2006
20.859 trl
+2.526 trl
13.78%
jan 1, 2007
23.149 trl
+2.291 trl
10.98%
jan 1, 2008
25.027 trl
+1.877 trl
8.11%
jan 1, 2009
26.671 trl
+1.644 trl
6.57%
jan 1, 2010
26.595 trl
-75.911 bln
-0.28%
jan 1, 2011
28.256 trl
+1.661 trl
6.25%
jan 1, 2012
30.275 trl
+2.019 trl
7.14%
jan 1, 2013
32.517 trl
+2.242 trl
7.41%
jan 1, 2014
34.936 trl
+2.419 trl
7.44%
jan 1, 2015
37.345 trl
+2.409 trl
6.9%
jan 1, 2016
39.934 trl
+2.589 trl
6.93%
Ranking of countries by current statistics by years


Comments: