29
/
en
AIzaSyAYiBZKx7MnpbEhh9jyipgxe19OcubqV5w
April 1, 2024
243666
Solomon Islands
SLB
true
2
1
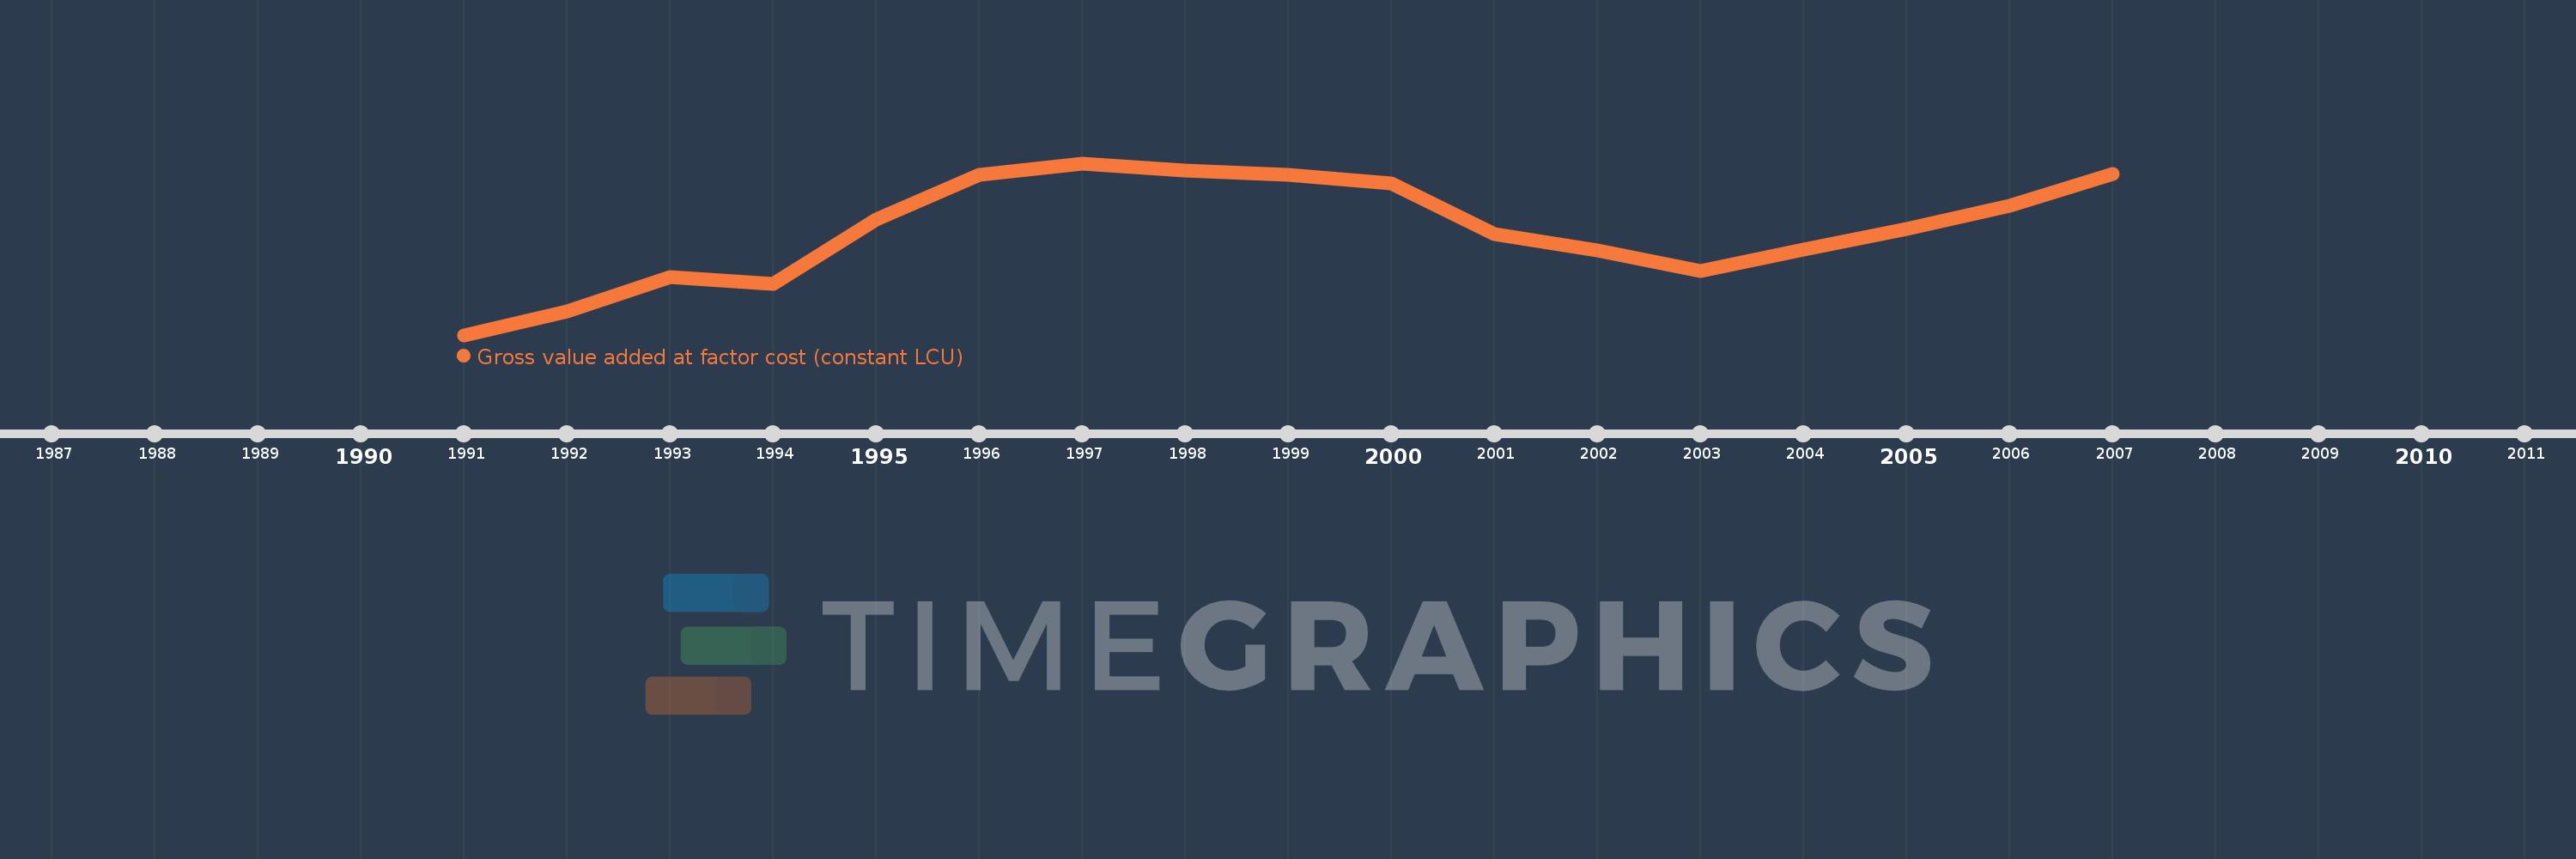
Gross value added at factor cost (constant LCU)
2007,2006,2005,2004,2003,2002,2001,2000,1999,1998,1997,1996,1995,1994,1993,1992,1991
This statistics in other country:
AfghanistanAlbaniaAlgeriaAntigua and BarbudaArgentinaArmeniaAustraliaAustriaAzerbaijanBahamas, TheBangladeshBelarusBelgiumBelizeBeninBermudaBhutanBoliviaBosnia and HerzegovinaBotswanaBrazilBulgariaBurkina FasoBurundiCabo VerdeCambodiaCameroonCanadaCayman IslandsCentral African RepublicChadChileColombiaCongo, Dem. Rep.Costa RicaCote d'IvoireCroatiaCubaCyprusCzech RepublicDenmarkDjiboutiDominicaDominican RepublicEcuadorEgypt, Arab Rep.El SalvadorEquatorial GuineaEritreaEstoniaEthiopiaFijiFinlandFranceGabonGambia, TheGeorgiaGermanyGhanaGreeceGrenadaGuatemalaGuineaGuinea-BissauGuyanaHaitiHondurasHong Kong SAR, ChinaHungaryIcelandIndiaIndonesiaIran, Islamic Rep.IrelandItalyJamaicaJapanJordanKazakhstanKenyaKiribatiKorea, Rep.KosovoKuwaitKyrgyz RepublicLao PDRLatviaLebanonLesothoLiberiaLithuaniaLuxembourgMacedonia, FYRMadagascarMalawiMaldivesMaliMarshall IslandsMauritaniaMauritiusMexicoMicronesia, Fed. Sts.MoldovaMongoliaMontenegroMoroccoMozambiqueNamibiaNepalNetherlandsNew ZealandNicaraguaNigeriaNorwayOmanPakistanPalauPanamaPapua New GuineaParaguayPeruPhilippinesPolandPortugalRomaniaRussian FederationRwandaSao Tome and PrincipeSenegalSerbiaSeychellesSierra LeoneSingaporeSlovak RepublicSloveniaSolomon IslandsSomaliaSouth AfricaSpainSri LankaSt. Kitts and NevisSt. LuciaSt. Vincent and the GrenadinesSudanSurinameSwazilandSwedenSwitzerlandSyrian Arab RepublicTajikistanTanzaniaThailandTimor-LesteTongaTrinidad and TobagoTunisiaTurkeyTurkmenistanTuvaluUgandaUkraineUnited Arab EmiratesUnited KingdomUnited StatesUruguayUzbekistanVanuatuVenezuela, RBVietnamWest Bank and GazaZambiaZimbabwe Timeline:
This timeline shows a graph from 1991 to 2007 of Solomon Islands. No data until 1990. Number of actual observations by date: 17.
Source name:
World Development Indicators
Source organization:
World Bank national accounts data, and OECD National Accounts data files.
Categories, topics:
Economy & Growth
Last updated:
apr 23, 2017
Indicators value changes by year
Minimum:
2.069 bln
jan 1, 1991
Maximum:
3.164 bln
jan 1, 1997
At the date of observation
Value
Absolute change
Change from previous value
jan 1, 1991
2.069 bln
+2.069 bln
0.0%
jan 1, 1992
2.218 bln
+149.177 mln
7.21%
jan 1, 1993
2.438 bln
+219.934 mln
9.91%
jan 1, 1994
2.395 bln
-43.266 mln
-1.77%
jan 1, 1995
2.804 bln
+408.771 mln
17.07%
jan 1, 1996
3.091 bln
+287.086 mln
10.24%
jan 1, 1997
3.164 bln
+73.462 mln
2.38%
jan 1, 1998
3.12 bln
-44.618 mln
-1.41%
jan 1, 1999
3.089 bln
-30.196 mln
-0.97%
jan 1, 2000
3.034 bln
-55.885 mln
-1.81%
jan 1, 2001
2.712 bln
-321.338 mln
-10.59%
jan 1, 2002
2.611 bln
-101.404 mln
-3.74%
jan 1, 2003
2.479 bln
-132.033 mln
-5.06%
jan 1, 2004
2.615 bln
+135.72 mln
5.48%
jan 1, 2005
2.747 bln
+132.0 mln
5.05%
jan 1, 2006
2.896 bln
+149.0 mln
5.43%
jan 1, 2007
3.096 bln
+200.9 mln
6.94%
Ranking of countries by current statistics by years


Comments: