29
/
en
AIzaSyAYiBZKx7MnpbEhh9jyipgxe19OcubqV5w
April 1, 2024
156067
Indonesia
IDN
true
2
1
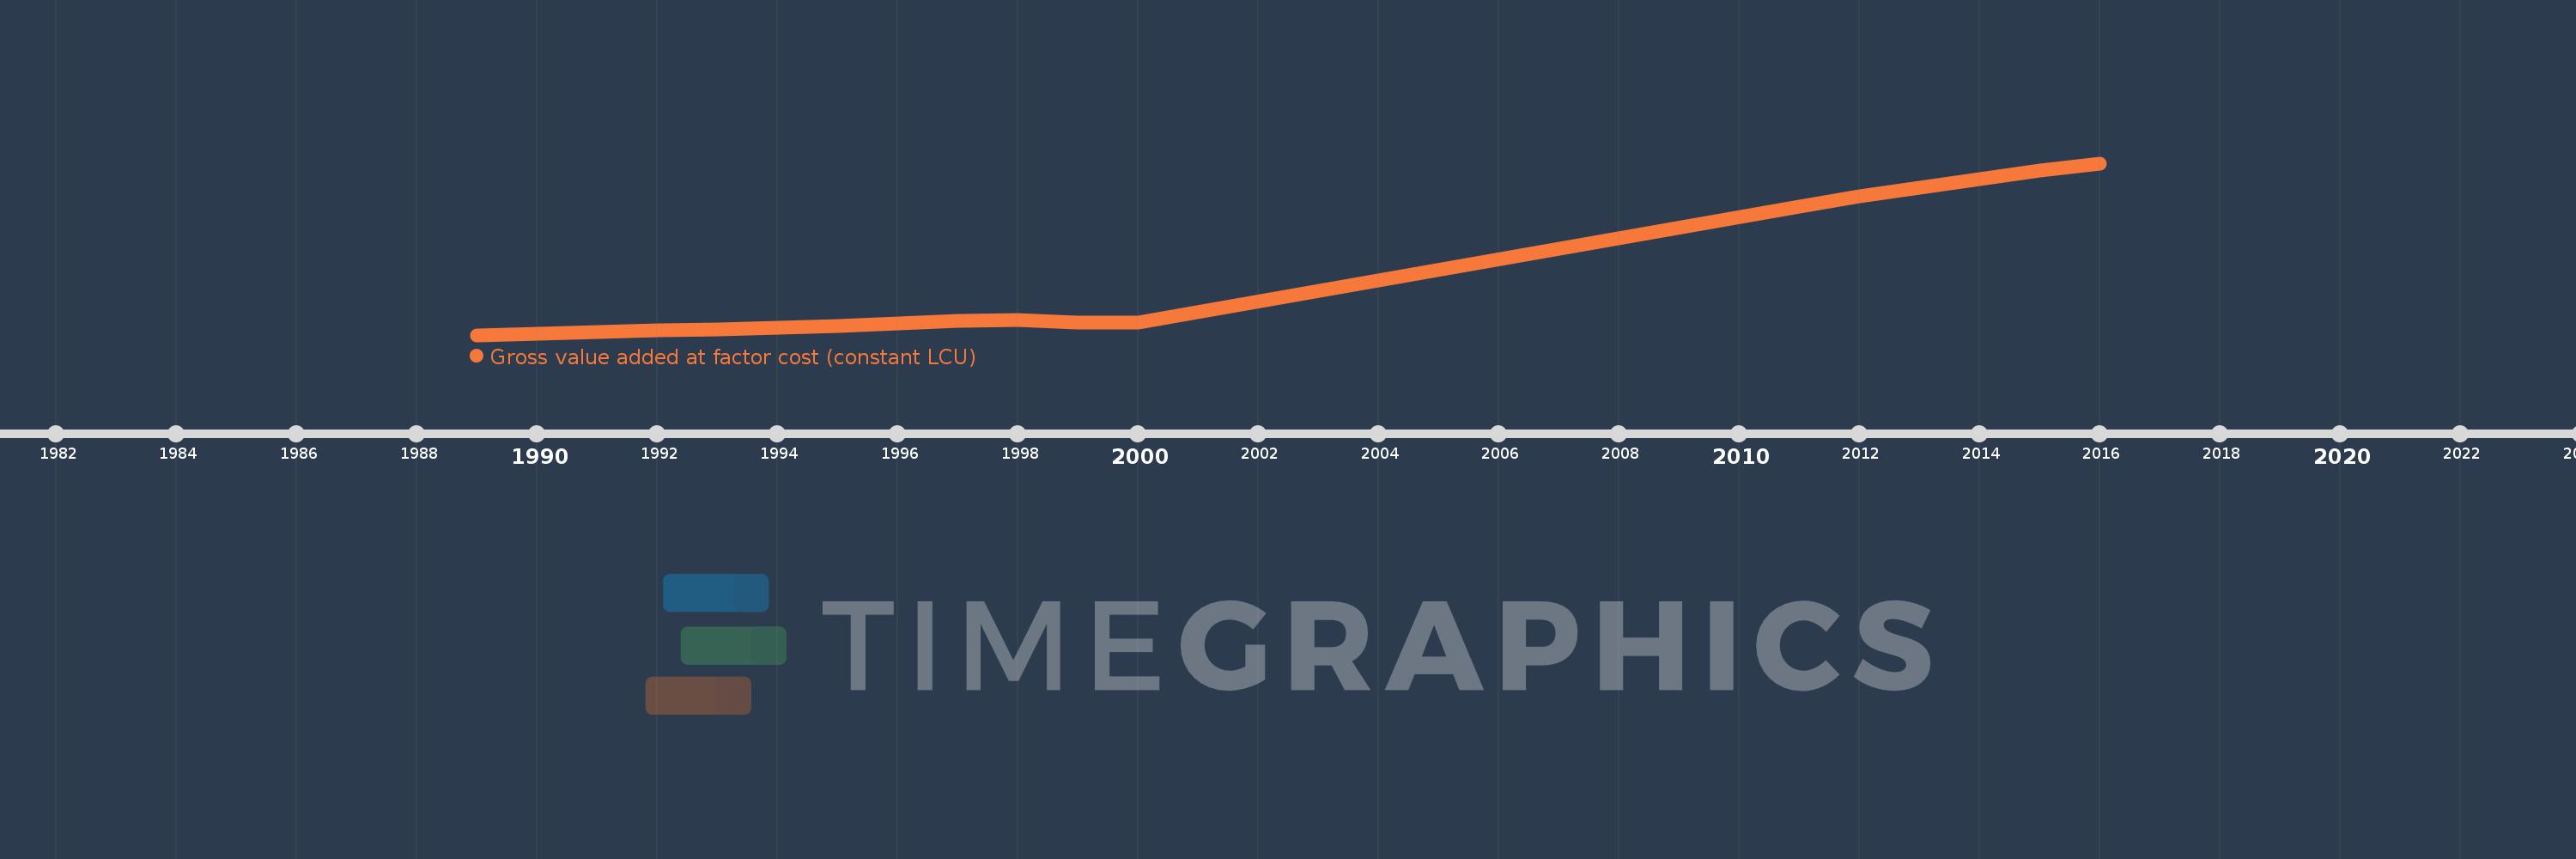
Gross value added at factor cost (constant LCU)
2016,2015,2014,2013,2012,2011,2000,1999,1998,1997,1996,1995,1994,1993,1992,1991,1990,1989
This statistics in other country:
AfghanistanAlbaniaAlgeriaAntigua and BarbudaArgentinaArmeniaAustraliaAustriaAzerbaijanBahamas, TheBangladeshBelarusBelgiumBelizeBeninBermudaBhutanBoliviaBosnia and HerzegovinaBotswanaBrazilBulgariaBurkina FasoBurundiCabo VerdeCambodiaCameroonCanadaCayman IslandsCentral African RepublicChadChileColombiaCongo, Dem. Rep.Costa RicaCote d'IvoireCroatiaCubaCyprusCzech RepublicDenmarkDjiboutiDominicaDominican RepublicEcuadorEgypt, Arab Rep.El SalvadorEquatorial GuineaEritreaEstoniaEthiopiaFijiFinlandFranceGabonGambia, TheGeorgiaGermanyGhanaGreeceGrenadaGuatemalaGuineaGuinea-BissauGuyanaHaitiHondurasHong Kong SAR, ChinaHungaryIcelandIndiaIndonesiaIran, Islamic Rep.IrelandItalyJamaicaJapanJordanKazakhstanKenyaKiribatiKorea, Rep.KosovoKuwaitKyrgyz RepublicLao PDRLatviaLebanonLesothoLiberiaLithuaniaLuxembourgMacedonia, FYRMadagascarMalawiMaldivesMaliMarshall IslandsMauritaniaMauritiusMexicoMicronesia, Fed. Sts.MoldovaMongoliaMontenegroMoroccoMozambiqueNamibiaNepalNetherlandsNew ZealandNicaraguaNigeriaNorwayOmanPakistanPalauPanamaPapua New GuineaParaguayPeruPhilippinesPolandPortugalRomaniaRussian FederationRwandaSao Tome and PrincipeSenegalSerbiaSeychellesSierra LeoneSingaporeSlovak RepublicSloveniaSolomon IslandsSomaliaSouth AfricaSpainSri LankaSt. Kitts and NevisSt. LuciaSt. Vincent and the GrenadinesSudanSurinameSwazilandSwedenSwitzerlandSyrian Arab RepublicTajikistanTanzaniaThailandTimor-LesteTongaTrinidad and TobagoTunisiaTurkeyTurkmenistanTuvaluUgandaUkraineUnited Arab EmiratesUnited KingdomUnited StatesUruguayUzbekistanVanuatuVenezuela, RBVietnamWest Bank and GazaZambiaZimbabwe Timeline:
This timeline shows a graph from 1989 to 2016 of Indonesia. No data until 1988. Number of actual observations by date: 18.
Source name:
World Development Indicators
Source organization:
World Bank national accounts data, and OECD National Accounts data files.
Categories, topics:
Economy & Growth
Last updated:
apr 23, 2017
Indicators value changes by year
Minimum:
724.776 trl
jan 1, 1989
Maximum:
8695.0 trl
jan 1, 2016
At the date of observation
Value
Absolute change
Change from previous value
jan 1, 1989
724.776 trl
+724.776 trl
0.0%
jan 1, 1990
783.092 trl
+58.316 trl
8.05%
jan 1, 1991
858.769 trl
+75.676 trl
9.66%
jan 1, 1992
938.475 trl
+79.706 trl
9.28%
jan 1, 1993
1002.833 trl
+64.358 trl
6.86%
jan 1, 1994
1075.25 trl
+72.417 trl
7.22%
jan 1, 1995
1158.229 trl
+82.979 trl
7.72%
jan 1, 1996
1257.982 trl
+99.753 trl
8.61%
jan 1, 1997
1363.289 trl
+105.307 trl
8.37%
jan 1, 1998
1418.393 trl
+55.104 trl
4.04%
jan 1, 1999
1304.719 trl
-113.674 trl
-8.01%
jan 1, 2000
1300.032 trl
-4.687 trl
-0.36%
jan 1, 2011
6683.68 trl
+5383.647 trl
414.12%
jan 1, 2012
7142.634 trl
+458.954 trl
6.87%
jan 1, 2013
7560.263 trl
+417.629 trl
5.85%
jan 1, 2014
7953.312 trl
+393.05 trl
5.2%
jan 1, 2015
8352.659 trl
+399.347 trl
5.02%
jan 1, 2016
8695.0 trl
+342.341 trl
4.1%
Ranking of countries by current statistics by years


Comments: