29
/
en
AIzaSyAYiBZKx7MnpbEhh9jyipgxe19OcubqV5w
April 1, 2024
135599
Gabon
GAB
true
2
1
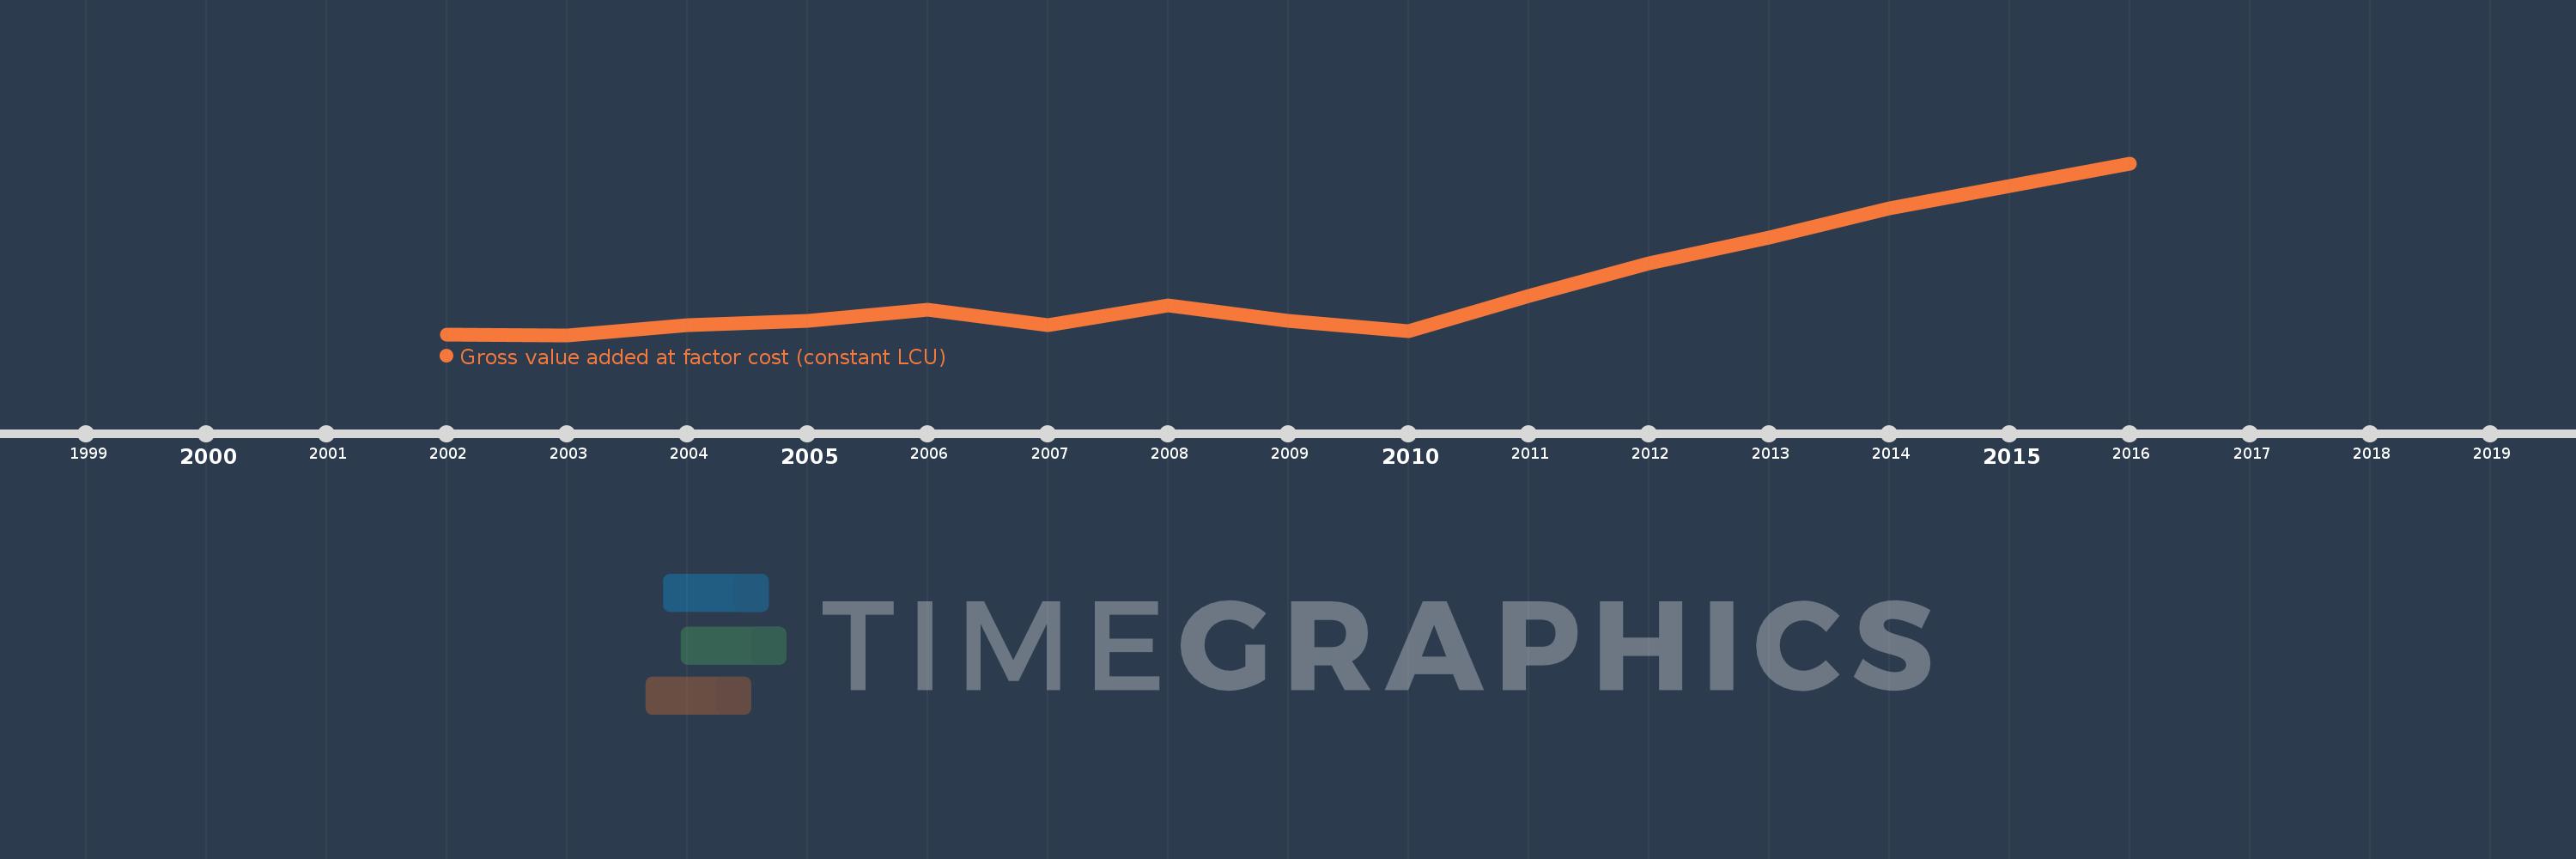
Gross value added at factor cost (constant LCU)
2016,2015,2014,2013,2012,2011,2010,2009,2008,2007,2006,2005,2004,2003,2002
This statistics in other country:
AfghanistanAlbaniaAlgeriaAntigua and BarbudaArgentinaArmeniaAustraliaAustriaAzerbaijanBahamas, TheBangladeshBelarusBelgiumBelizeBeninBermudaBhutanBoliviaBosnia and HerzegovinaBotswanaBrazilBulgariaBurkina FasoBurundiCabo VerdeCambodiaCameroonCanadaCayman IslandsCentral African RepublicChadChileColombiaCongo, Dem. Rep.Costa RicaCote d'IvoireCroatiaCubaCyprusCzech RepublicDenmarkDjiboutiDominicaDominican RepublicEcuadorEgypt, Arab Rep.El SalvadorEquatorial GuineaEritreaEstoniaEthiopiaFijiFinlandFranceGabonGambia, TheGeorgiaGermanyGhanaGreeceGrenadaGuatemalaGuineaGuinea-BissauGuyanaHaitiHondurasHong Kong SAR, ChinaHungaryIcelandIndiaIndonesiaIran, Islamic Rep.IrelandItalyJamaicaJapanJordanKazakhstanKenyaKiribatiKorea, Rep.KosovoKuwaitKyrgyz RepublicLao PDRLatviaLebanonLesothoLiberiaLithuaniaLuxembourgMacedonia, FYRMadagascarMalawiMaldivesMaliMarshall IslandsMauritaniaMauritiusMexicoMicronesia, Fed. Sts.MoldovaMongoliaMontenegroMoroccoMozambiqueNamibiaNepalNetherlandsNew ZealandNicaraguaNigeriaNorwayOmanPakistanPalauPanamaPapua New GuineaParaguayPeruPhilippinesPolandPortugalRomaniaRussian FederationRwandaSao Tome and PrincipeSenegalSerbiaSeychellesSierra LeoneSingaporeSlovak RepublicSloveniaSolomon IslandsSomaliaSouth AfricaSpainSri LankaSt. Kitts and NevisSt. LuciaSt. Vincent and the GrenadinesSudanSurinameSwazilandSwedenSwitzerlandSyrian Arab RepublicTajikistanTanzaniaThailandTimor-LesteTongaTrinidad and TobagoTunisiaTurkeyTurkmenistanTuvaluUgandaUkraineUnited Arab EmiratesUnited KingdomUnited StatesUruguayUzbekistanVanuatuVenezuela, RBVietnamWest Bank and GazaZambiaZimbabwe Timeline:
This timeline shows a graph from 2002 to 2016 of Gabon. No data until 2001. Number of actual observations by date: 15.
Source name:
World Development Indicators
Source organization:
World Bank national accounts data, and OECD National Accounts data files.
Categories, topics:
Economy & Growth
Last updated:
apr 23, 2017
Indicators value changes by year
Minimum:
3.373 trl
jan 1, 2003
Maximum:
4.78 trl
jan 1, 2016
At the date of observation
Value
Absolute change
Change from previous value
jan 1, 2002
3.377 trl
+3.377 trl
0.0%
jan 1, 2003
3.373 trl
-3.803 bln
-0.11%
jan 1, 2004
3.452 trl
+78.415 bln
2.32%
jan 1, 2005
3.486 trl
+34.598 bln
1.0%
jan 1, 2006
3.583 trl
+96.503 bln
2.77%
jan 1, 2007
3.453 trl
-129.752 bln
-3.62%
jan 1, 2008
3.615 trl
+162.233 bln
4.7%
jan 1, 2009
3.492 trl
-123.877 bln
-3.43%
jan 1, 2010
3.406 trl
-85.41 bln
-2.45%
jan 1, 2011
3.694 trl
+287.59 bln
8.44%
jan 1, 2012
3.96 trl
+265.964 bln
7.2%
jan 1, 2013
4.169 trl
+208.917 bln
5.28%
jan 1, 2014
4.407 trl
+238.817 bln
5.73%
jan 1, 2015
4.59 trl
+182.95 bln
4.15%
jan 1, 2016
4.78 trl
+189.488 bln
4.13%
Ranking of countries by current statistics by years


Comments: