29
/
en
AIzaSyAYiBZKx7MnpbEhh9jyipgxe19OcubqV5w
April 1, 2024
238338
Seychelles
SYC
true
2
1
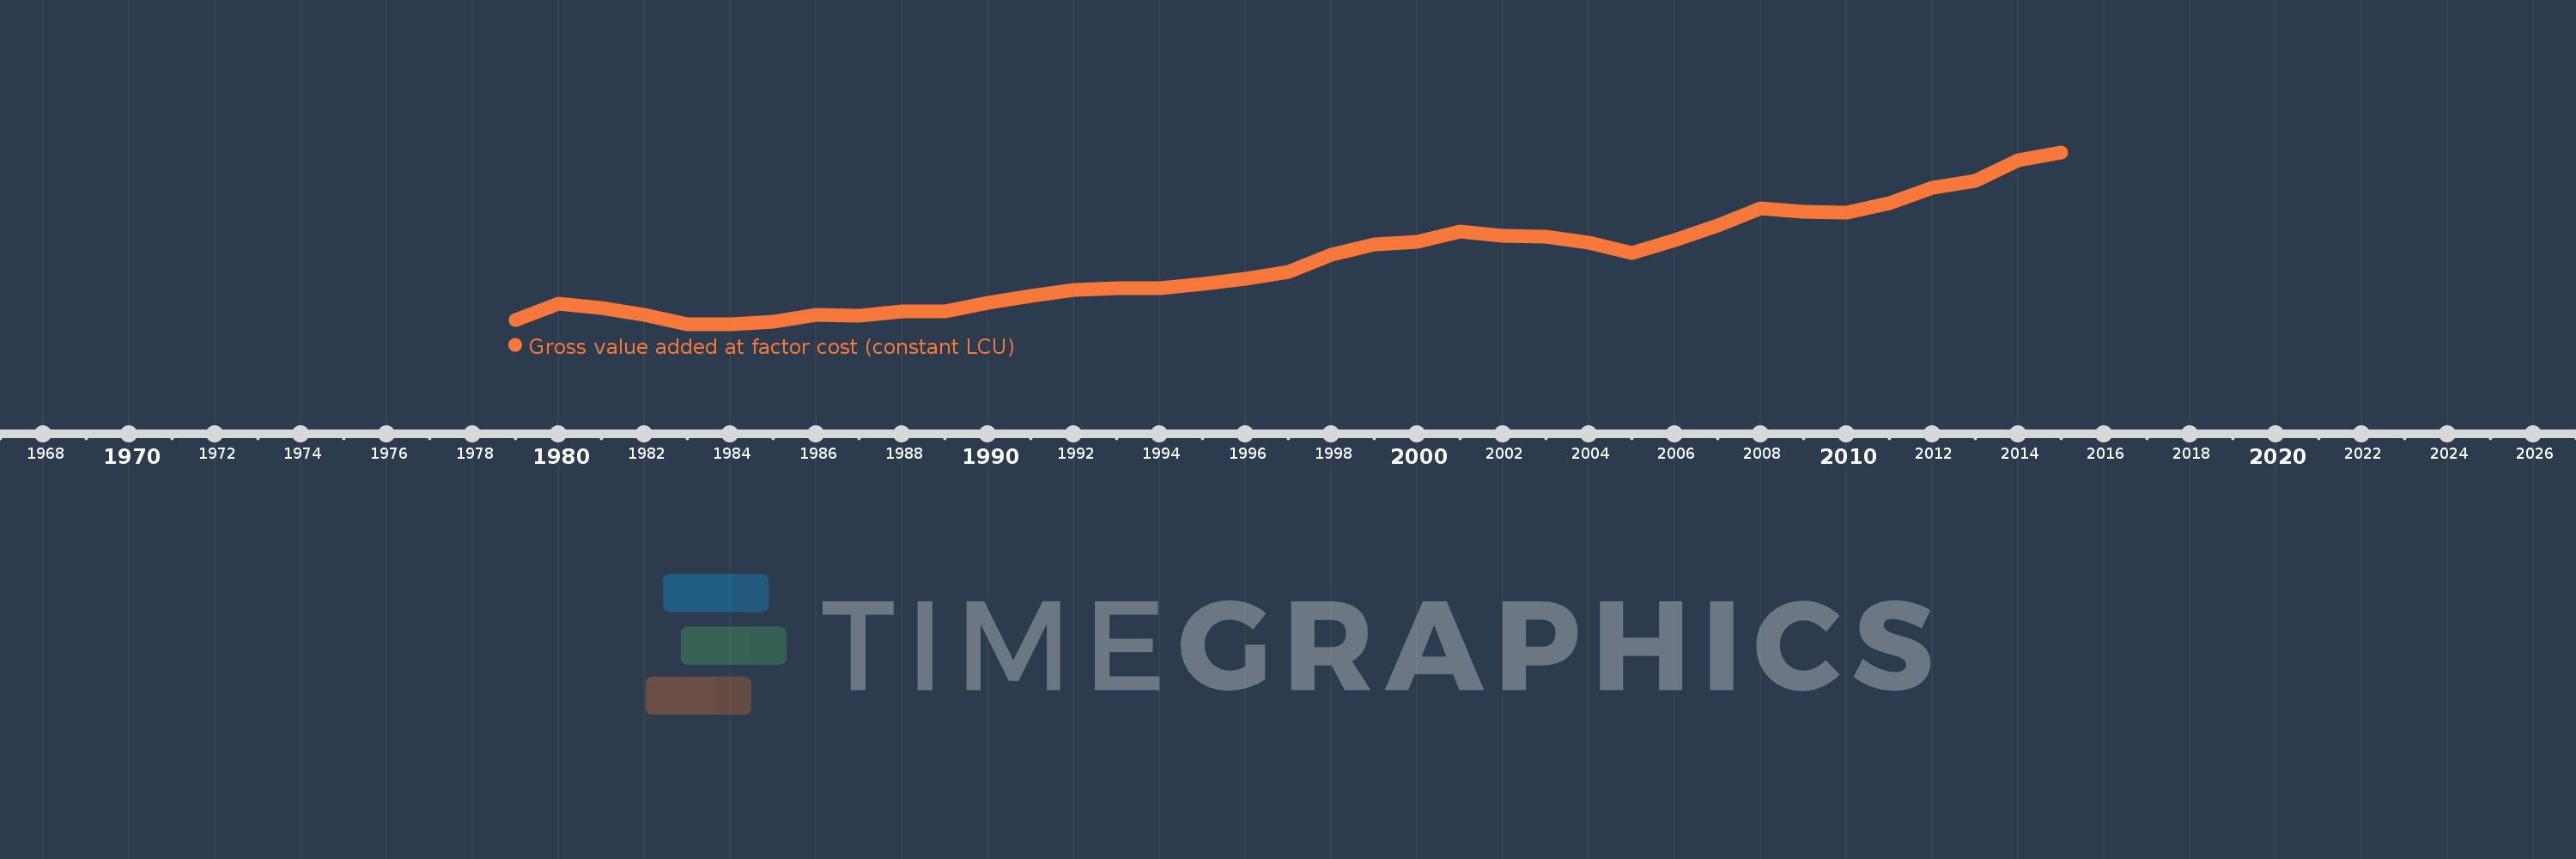
Gross value added at factor cost (constant LCU)
2015,2014,2013,2012,2011,2010,2009,2008,2007,2006,2005,2004,2003,2002,2001,2000,1999,1998,1997,1996,1995,1994,1993,1992,1991,1990,1989,1988,1987,1986,1985,1984,1983,1982,1981,1980,1979
This statistics in other country:
AfghanistanAlbaniaAlgeriaAntigua and BarbudaArgentinaArmeniaAustraliaAustriaAzerbaijanBahamas, TheBangladeshBelarusBelgiumBelizeBeninBermudaBhutanBoliviaBosnia and HerzegovinaBotswanaBrazilBulgariaBurkina FasoBurundiCabo VerdeCambodiaCameroonCanadaCayman IslandsCentral African RepublicChadChileColombiaCongo, Dem. Rep.Costa RicaCote d'IvoireCroatiaCubaCyprusCzech RepublicDenmarkDjiboutiDominicaDominican RepublicEcuadorEgypt, Arab Rep.El SalvadorEquatorial GuineaEritreaEstoniaEthiopiaFijiFinlandFranceGabonGambia, TheGeorgiaGermanyGhanaGreeceGrenadaGuatemalaGuineaGuinea-BissauGuyanaHaitiHondurasHong Kong SAR, ChinaHungaryIcelandIndiaIndonesiaIran, Islamic Rep.IrelandItalyJamaicaJapanJordanKazakhstanKenyaKiribatiKorea, Rep.KosovoKuwaitKyrgyz RepublicLao PDRLatviaLebanonLesothoLiberiaLithuaniaLuxembourgMacedonia, FYRMadagascarMalawiMaldivesMaliMarshall IslandsMauritaniaMauritiusMexicoMicronesia, Fed. Sts.MoldovaMongoliaMontenegroMoroccoMozambiqueNamibiaNepalNetherlandsNew ZealandNicaraguaNigeriaNorwayOmanPakistanPalauPanamaPapua New GuineaParaguayPeruPhilippinesPolandPortugalRomaniaRussian FederationRwandaSao Tome and PrincipeSenegalSerbiaSeychellesSierra LeoneSingaporeSlovak RepublicSloveniaSolomon IslandsSomaliaSouth AfricaSpainSri LankaSt. Kitts and NevisSt. LuciaSt. Vincent and the GrenadinesSudanSurinameSwazilandSwedenSwitzerlandSyrian Arab RepublicTajikistanTanzaniaThailandTimor-LesteTongaTrinidad and TobagoTunisiaTurkeyTurkmenistanTuvaluUgandaUkraineUnited Arab EmiratesUnited KingdomUnited StatesUruguayUzbekistanVanuatuVenezuela, RBVietnamWest Bank and GazaZambiaZimbabwe Timeline:
This timeline shows a graph from 1979 to 2015 of Seychelles. No data until 1978. Number of actual observations by date: 37.
Source name:
World Development Indicators
Source organization:
World Bank national accounts data, and OECD National Accounts data files.
Categories, topics:
Economy & Growth
Last updated:
apr 23, 2017
Indicators value changes by year
Minimum:
1.952 bln
jan 1, 1983
Maximum:
6.858 bln
jan 1, 2015
At the date of observation
Value
Absolute change
Change from previous value
jan 1, 1979
2.084 bln
+2.084 bln
0.0%
jan 1, 1980
2.536 bln
+451.704 mln
21.68%
jan 1, 1981
2.428 bln
-107.729 mln
-4.25%
jan 1, 1982
2.228 bln
-199.46 mln
-8.22%
jan 1, 1983
1.952 bln
-276.169 mln
-12.39%
jan 1, 1984
1.959 bln
+6.601 mln
0.34%
jan 1, 1985
2.029 bln
+69.794 mln
3.56%
jan 1, 1986
2.225 bln
+196.124 mln
9.67%
jan 1, 1987
2.2 bln
-24.991 mln
-1.12%
jan 1, 1988
2.326 bln
+126.335 mln
5.74%
jan 1, 1989
2.326 bln
-528.3K
-0.02%
jan 1, 1990
2.562 bln
+236.349 mln
10.16%
jan 1, 1991
2.75 bln
+187.918 mln
7.33%
jan 1, 1992
2.926 bln
+176.173 mln
6.41%
jan 1, 1993
2.97 bln
+44.145 mln
1.51%
jan 1, 1994
2.968 bln
-2.025 mln
-0.07%
jan 1, 1995
3.1 bln
+132.029 mln
4.45%
jan 1, 1996
3.258 bln
+157.914 mln
5.09%
jan 1, 1997
3.447 bln
+188.931 mln
5.8%
jan 1, 1998
3.927 bln
+479.722 mln
13.92%
jan 1, 1999
4.234 bln
+306.815 mln
7.81%
jan 1, 2000
4.316 bln
+82.214 mln
1.94%
jan 1, 2001
4.593 bln
+276.815 mln
6.41%
jan 1, 2002
4.48 bln
-112.184 mln
-2.44%
jan 1, 2003
4.45 bln
-30.75 mln
-0.69%
jan 1, 2004
4.275 bln
-174.246 mln
-3.92%
jan 1, 2005
3.986 bln
-289.606 mln
-6.77%
jan 1, 2006
4.358 bln
+372.555 mln
9.35%
jan 1, 2007
4.775 bln
+416.665 mln
9.56%
jan 1, 2008
5.257 bln
+482.112 mln
10.1%
jan 1, 2009
5.175 bln
-82.201 mln
-1.56%
jan 1, 2010
5.136 bln
-39.458 mln
-0.76%
jan 1, 2011
5.406 bln
+270.561 mln
5.27%
jan 1, 2012
5.839 bln
+432.704 mln
8.0%
jan 1, 2013
6.04 bln
+201.679 mln
3.45%
jan 1, 2014
6.634 bln
+593.332 mln
9.82%
jan 1, 2015
6.858 bln
+223.756 mln
3.37%
Ranking of countries by current statistics by years


Comments: