29
/
en
AIzaSyAYiBZKx7MnpbEhh9jyipgxe19OcubqV5w
April 1, 2024
63566
Afghanistan
AFG
true
2
1
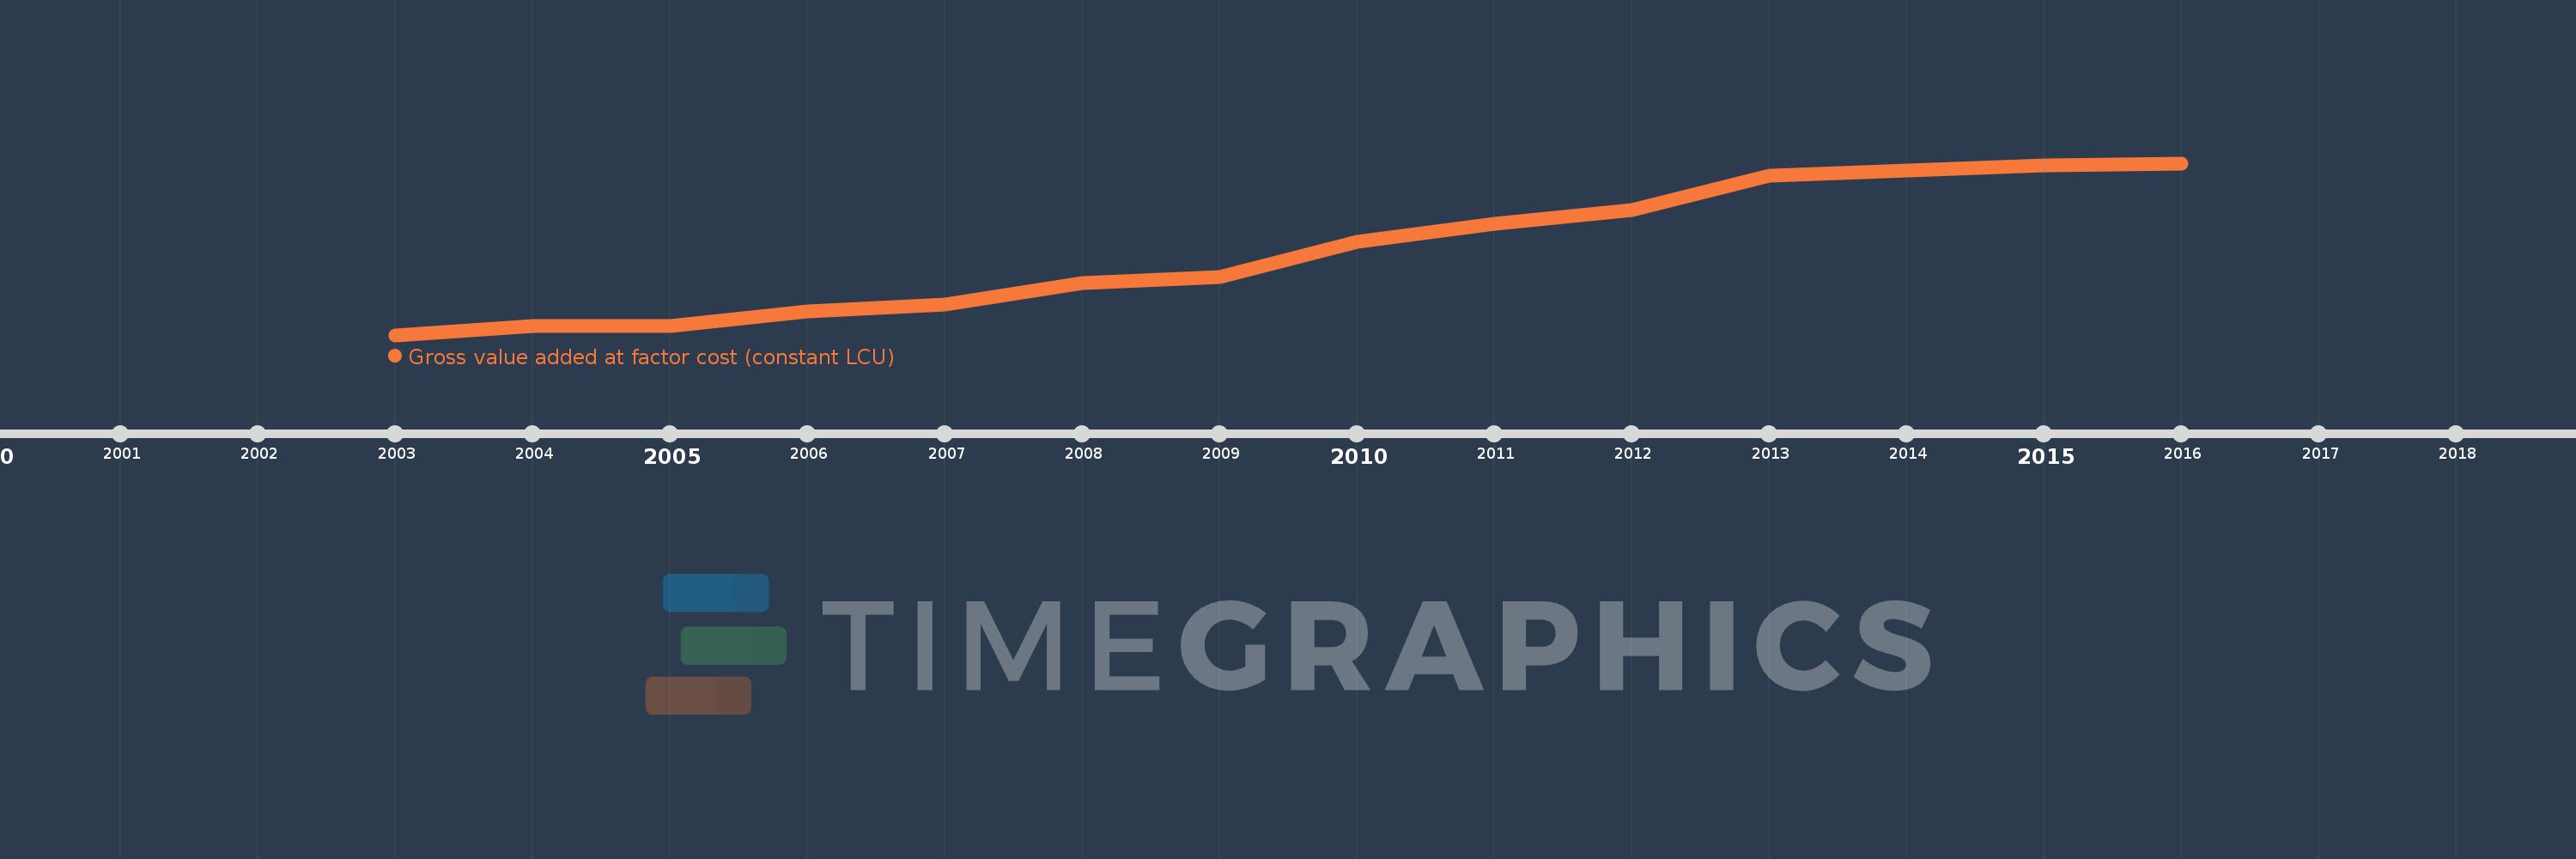
Gross value added at factor cost (constant LCU)
2016,2015,2014,2013,2012,2011,2010,2009,2008,2007,2006,2005,2004,2003
This statistics in other country:
AfghanistanAlbaniaAlgeriaAntigua and BarbudaArgentinaArmeniaAustraliaAustriaAzerbaijanBahamas, TheBangladeshBelarusBelgiumBelizeBeninBermudaBhutanBoliviaBosnia and HerzegovinaBotswanaBrazilBulgariaBurkina FasoBurundiCabo VerdeCambodiaCameroonCanadaCayman IslandsCentral African RepublicChadChileColombiaCongo, Dem. Rep.Costa RicaCote d'IvoireCroatiaCubaCyprusCzech RepublicDenmarkDjiboutiDominicaDominican RepublicEcuadorEgypt, Arab Rep.El SalvadorEquatorial GuineaEritreaEstoniaEthiopiaFijiFinlandFranceGabonGambia, TheGeorgiaGermanyGhanaGreeceGrenadaGuatemalaGuineaGuinea-BissauGuyanaHaitiHondurasHong Kong SAR, ChinaHungaryIcelandIndiaIndonesiaIran, Islamic Rep.IrelandItalyJamaicaJapanJordanKazakhstanKenyaKiribatiKorea, Rep.KosovoKuwaitKyrgyz RepublicLao PDRLatviaLebanonLesothoLiberiaLithuaniaLuxembourgMacedonia, FYRMadagascarMalawiMaldivesMaliMarshall IslandsMauritaniaMauritiusMexicoMicronesia, Fed. Sts.MoldovaMongoliaMontenegroMoroccoMozambiqueNamibiaNepalNetherlandsNew ZealandNicaraguaNigeriaNorwayOmanPakistanPalauPanamaPapua New GuineaParaguayPeruPhilippinesPolandPortugalRomaniaRussian FederationRwandaSao Tome and PrincipeSenegalSerbiaSeychellesSierra LeoneSingaporeSlovak RepublicSloveniaSolomon IslandsSomaliaSouth AfricaSpainSri LankaSt. Kitts and NevisSt. LuciaSt. Vincent and the GrenadinesSudanSurinameSwazilandSwedenSwitzerlandSyrian Arab RepublicTajikistanTanzaniaThailandTimor-LesteTongaTrinidad and TobagoTunisiaTurkeyTurkmenistanTuvaluUgandaUkraineUnited Arab EmiratesUnited KingdomUnited StatesUruguayUzbekistanVanuatuVenezuela, RBVietnamWest Bank and GazaZambiaZimbabwe Timeline:
This timeline shows a graph from 2003 to 2016 of Afghanistan. No data until 2002. Number of actual observations by date: 14.
Source name:
World Development Indicators
Source organization:
World Bank national accounts data, and OECD National Accounts data files.
Categories, topics:
Economy & Growth
Last updated:
apr 23, 2017
Indicators value changes by year
Minimum:
182.9 bln
jan 1, 2003
Maximum:
450.739 bln
jan 1, 2016
At the date of observation
Value
Absolute change
Change from previous value
jan 1, 2003
182.9 bln
+182.9 bln
0.0%
jan 1, 2004
196.503 bln
+13.603 bln
7.44%
jan 1, 2005
197.491 bln
+987.423 mln
0.5%
jan 1, 2006
219.346 bln
+21.855 bln
11.07%
jan 1, 2007
231.088 bln
+11.741 bln
5.35%
jan 1, 2008
264.37 bln
+33.282 bln
14.4%
jan 1, 2009
273.921 bln
+9.551 bln
3.61%
jan 1, 2010
328.764 bln
+54.843 bln
20.02%
jan 1, 2011
356.292 bln
+27.528 bln
8.37%
jan 1, 2012
377.615 bln
+21.323 bln
5.98%
jan 1, 2013
431.385 bln
+53.77 bln
14.24%
jan 1, 2014
439.37 bln
+7.985 bln
1.85%
jan 1, 2015
447.238 bln
+7.868 bln
1.79%
jan 1, 2016
450.739 bln
+3.501 bln
0.78%
Ranking of countries by current statistics by years


Comments: