29
/
en
AIzaSyAYiBZKx7MnpbEhh9jyipgxe19OcubqV5w
April 1, 2024
151655
Hong Kong SAR, China
HKG
true
2
1
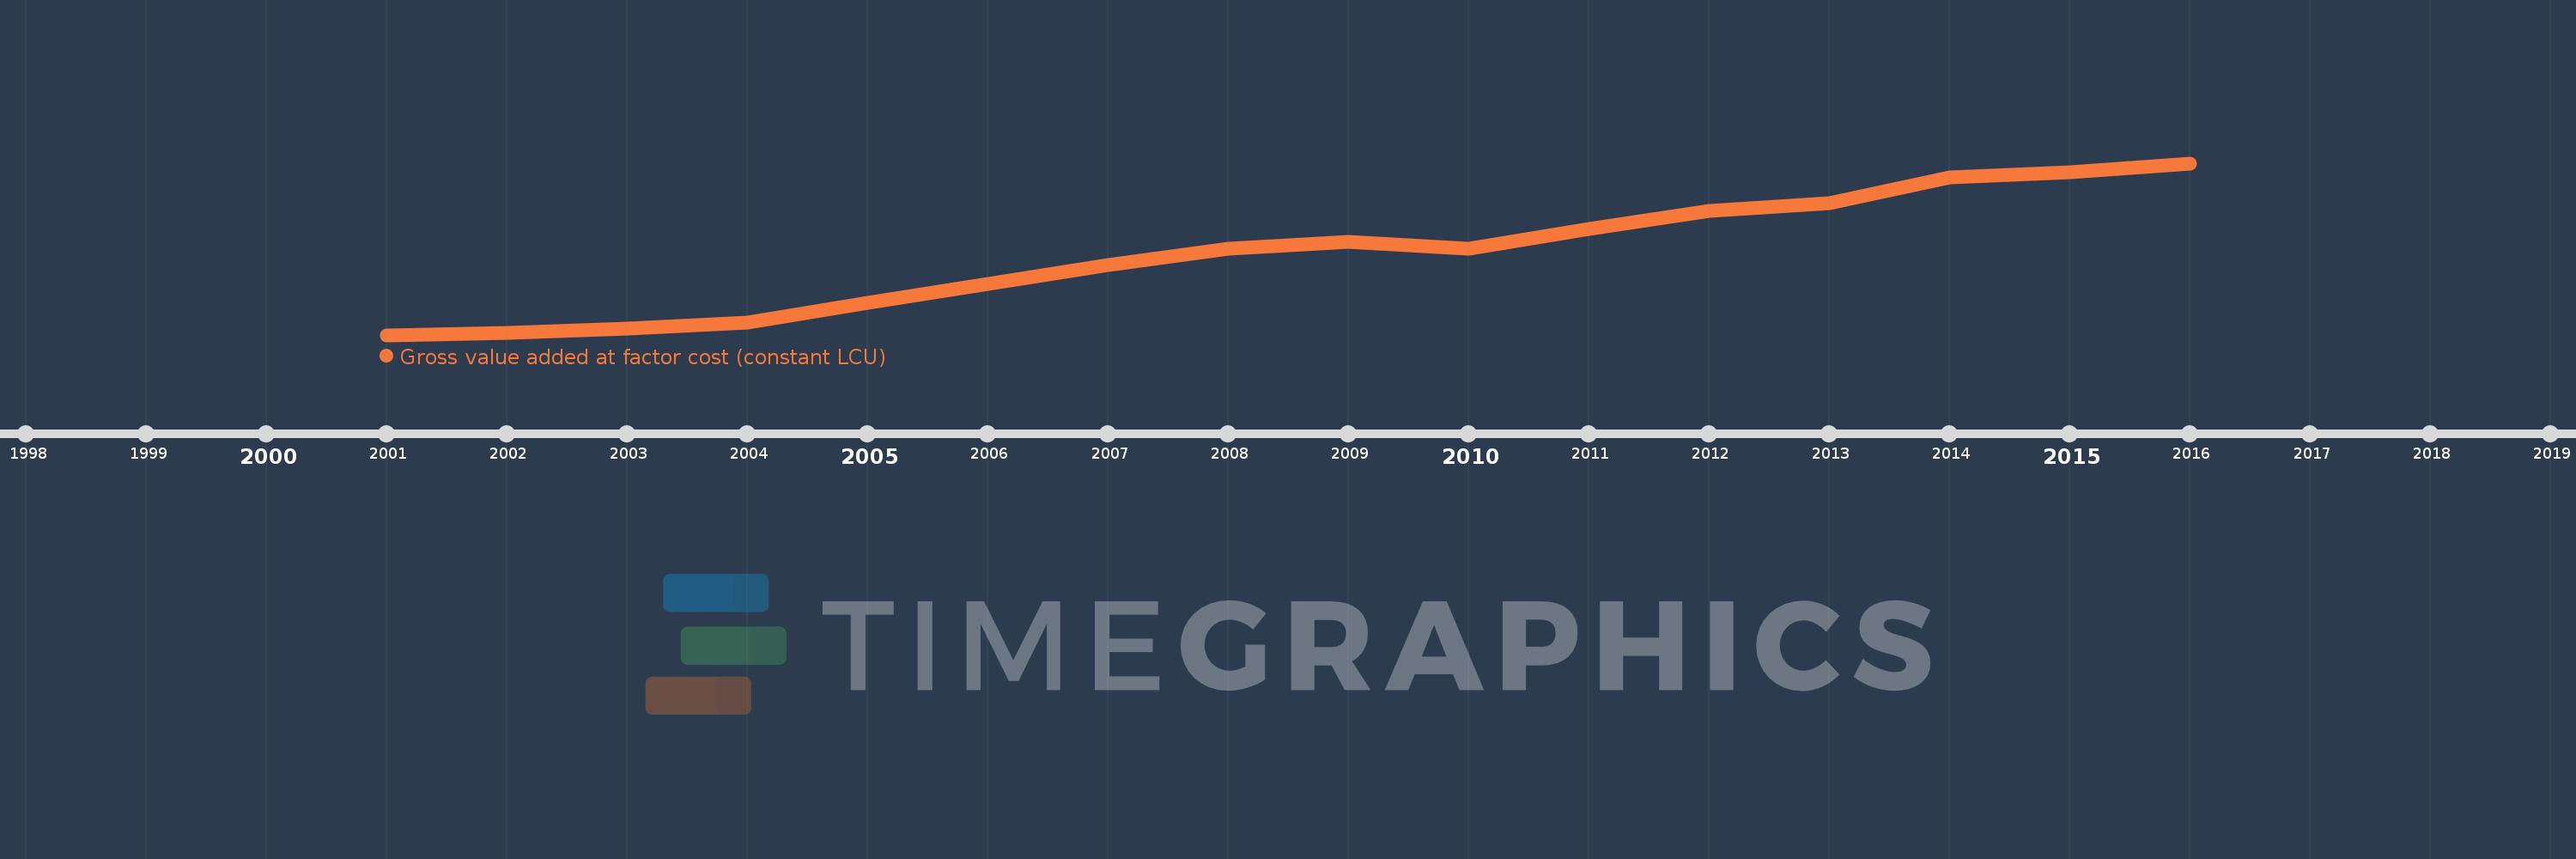
Gross value added at factor cost (constant LCU)
2016,2015,2014,2013,2012,2011,2010,2009,2008,2007,2006,2005,2004,2003,2002,2001
This statistics in other country:
AfghanistanAlbaniaAlgeriaAntigua and BarbudaArgentinaArmeniaAustraliaAustriaAzerbaijanBahamas, TheBangladeshBelarusBelgiumBelizeBeninBermudaBhutanBoliviaBosnia and HerzegovinaBotswanaBrazilBulgariaBurkina FasoBurundiCabo VerdeCambodiaCameroonCanadaCayman IslandsCentral African RepublicChadChileColombiaCongo, Dem. Rep.Costa RicaCote d'IvoireCroatiaCubaCyprusCzech RepublicDenmarkDjiboutiDominicaDominican RepublicEcuadorEgypt, Arab Rep.El SalvadorEquatorial GuineaEritreaEstoniaEthiopiaFijiFinlandFranceGabonGambia, TheGeorgiaGermanyGhanaGreeceGrenadaGuatemalaGuineaGuinea-BissauGuyanaHaitiHondurasHong Kong SAR, ChinaHungaryIcelandIndiaIndonesiaIran, Islamic Rep.IrelandItalyJamaicaJapanJordanKazakhstanKenyaKiribatiKorea, Rep.KosovoKuwaitKyrgyz RepublicLao PDRLatviaLebanonLesothoLiberiaLithuaniaLuxembourgMacedonia, FYRMadagascarMalawiMaldivesMaliMarshall IslandsMauritaniaMauritiusMexicoMicronesia, Fed. Sts.MoldovaMongoliaMontenegroMoroccoMozambiqueNamibiaNepalNetherlandsNew ZealandNicaraguaNigeriaNorwayOmanPakistanPalauPanamaPapua New GuineaParaguayPeruPhilippinesPolandPortugalRomaniaRussian FederationRwandaSao Tome and PrincipeSenegalSerbiaSeychellesSierra LeoneSingaporeSlovak RepublicSloveniaSolomon IslandsSomaliaSouth AfricaSpainSri LankaSt. Kitts and NevisSt. LuciaSt. Vincent and the GrenadinesSudanSurinameSwazilandSwedenSwitzerlandSyrian Arab RepublicTajikistanTanzaniaThailandTimor-LesteTongaTrinidad and TobagoTunisiaTurkeyTurkmenistanTuvaluUgandaUkraineUnited Arab EmiratesUnited KingdomUnited StatesUruguayUzbekistanVanuatuVenezuela, RBVietnamWest Bank and GazaZambiaZimbabwe Timeline:
This timeline shows a graph from 2001 to 2016 of Hong Kong SAR, China. No data until 2000. Number of actual observations by date: 16.
Source name:
World Development Indicators
Source organization:
World Bank national accounts data, and OECD National Accounts data files.
Categories, topics:
Economy & Growth
Last updated:
apr 23, 2017
Indicators value changes by year
Minimum:
1.24 trl
jan 1, 2001
Maximum:
2.224 trl
jan 1, 2016
At the date of observation
Value
Absolute change
Change from previous value
jan 1, 2001
1.24 trl
+1.24 trl
0.0%
jan 1, 2002
1.253 trl
+12.675 bln
1.02%
jan 1, 2003
1.276 trl
+23.3 bln
1.86%
jan 1, 2004
1.314 trl
+37.615 bln
2.95%
jan 1, 2005
1.423 trl
+109.407 bln
8.33%
jan 1, 2006
1.534 trl
+111.078 bln
7.81%
jan 1, 2007
1.642 trl
+107.689 bln
7.02%
jan 1, 2008
1.733 trl
+91.686 bln
5.58%
jan 1, 2009
1.774 trl
+40.576 bln
2.34%
jan 1, 2010
1.732 trl
-41.617 bln
-2.35%
jan 1, 2011
1.85 trl
+117.686 bln
6.79%
jan 1, 2012
1.95 trl
+100.03 bln
5.41%
jan 1, 2013
1.994 trl
+44.23 bln
2.27%
jan 1, 2014
2.145 trl
+151.024 bln
7.57%
jan 1, 2015
2.175 trl
+29.604 bln
1.38%
jan 1, 2016
2.224 trl
+49.229 bln
2.26%
Ranking of countries by current statistics by years


Comments: