29
/
en
AIzaSyAYiBZKx7MnpbEhh9jyipgxe19OcubqV5w
April 1, 2024
244640
Somalia
SOM
true
2
1
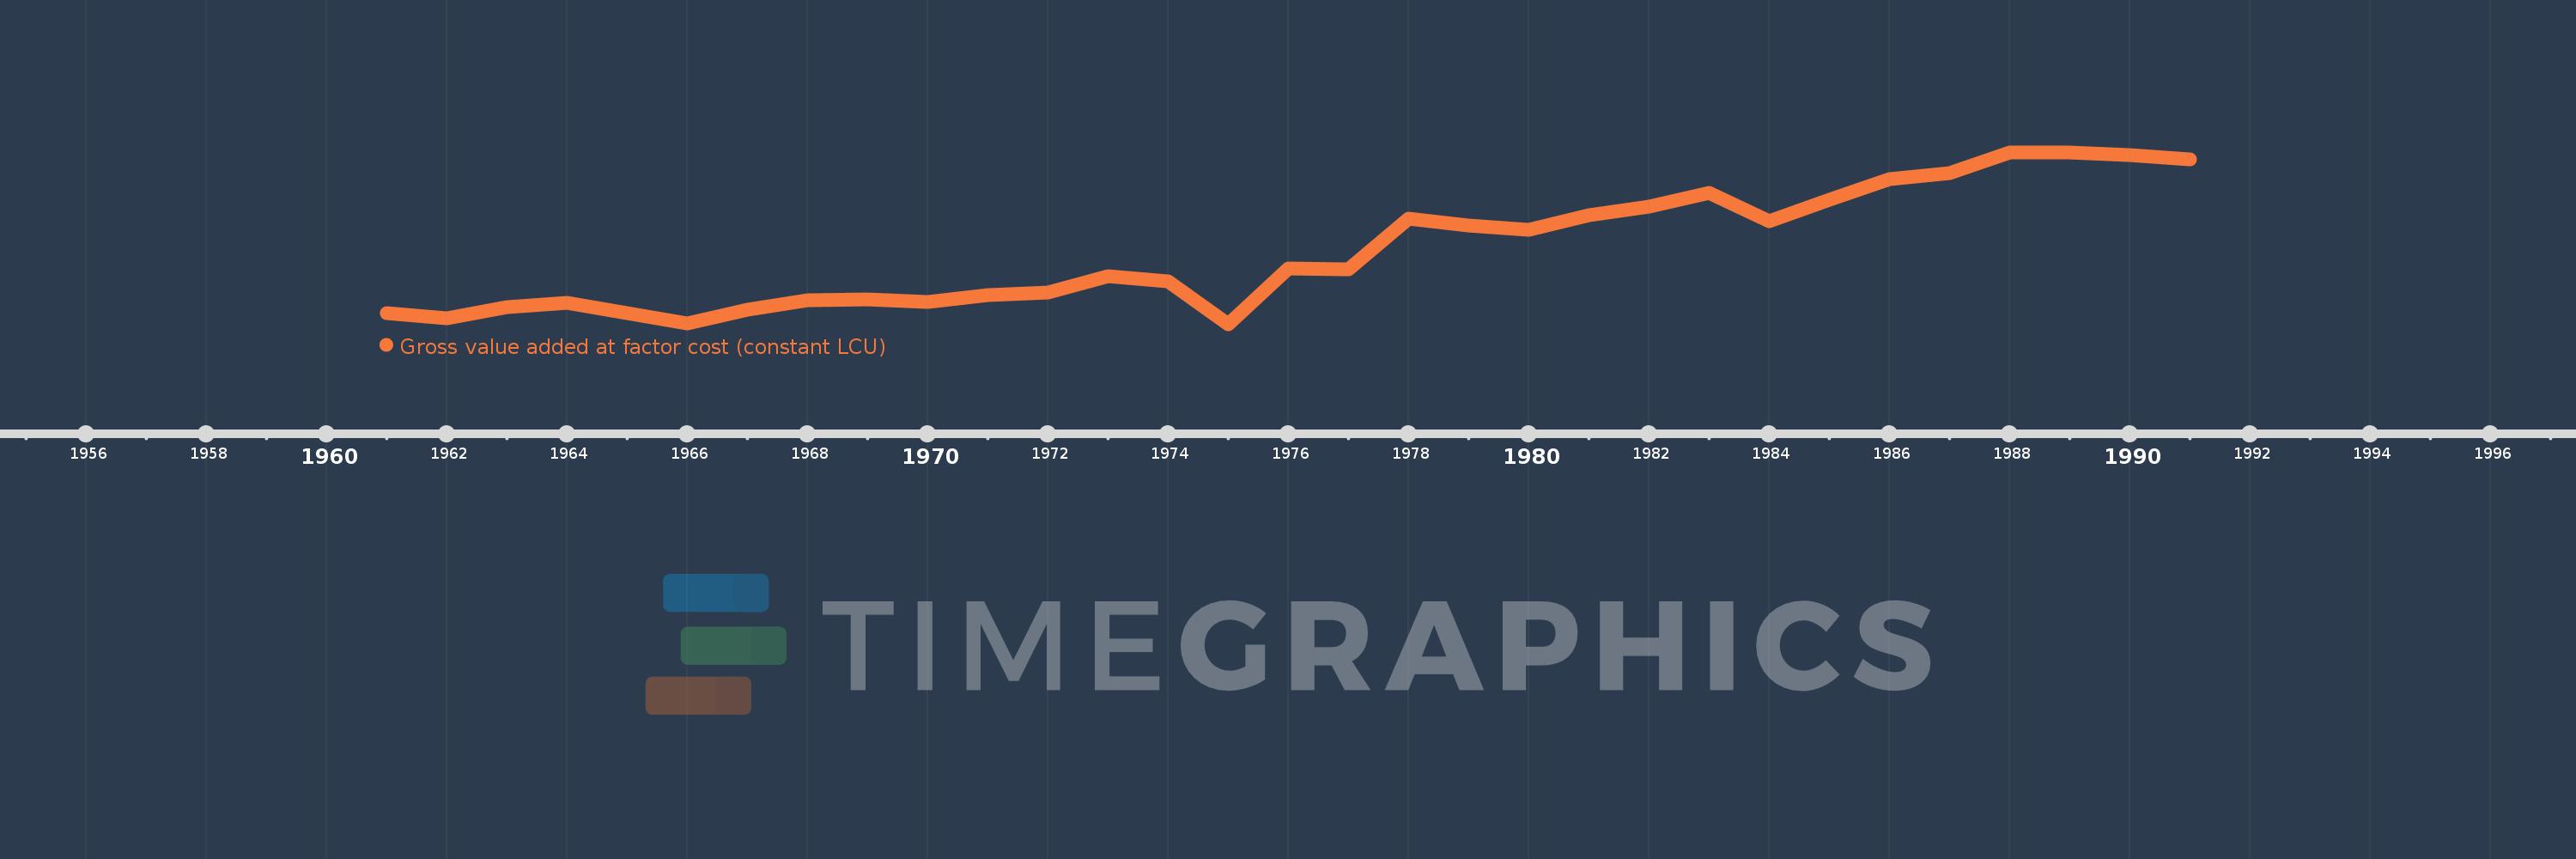
Gross value added at factor cost (constant LCU)
1991,1990,1989,1988,1987,1986,1985,1984,1983,1982,1981,1980,1979,1978,1977,1976,1975,1974,1973,1972,1971,1970,1969,1968,1967,1966,1965,1964,1963,1962,1961
This statistics in other country:
AfghanistanAlbaniaAlgeriaAntigua and BarbudaArgentinaArmeniaAustraliaAustriaAzerbaijanBahamas, TheBangladeshBelarusBelgiumBelizeBeninBermudaBhutanBoliviaBosnia and HerzegovinaBotswanaBrazilBulgariaBurkina FasoBurundiCabo VerdeCambodiaCameroonCanadaCayman IslandsCentral African RepublicChadChileColombiaCongo, Dem. Rep.Costa RicaCote d'IvoireCroatiaCubaCyprusCzech RepublicDenmarkDjiboutiDominicaDominican RepublicEcuadorEgypt, Arab Rep.El SalvadorEquatorial GuineaEritreaEstoniaEthiopiaFijiFinlandFranceGabonGambia, TheGeorgiaGermanyGhanaGreeceGrenadaGuatemalaGuineaGuinea-BissauGuyanaHaitiHondurasHong Kong SAR, ChinaHungaryIcelandIndiaIndonesiaIran, Islamic Rep.IrelandItalyJamaicaJapanJordanKazakhstanKenyaKiribatiKorea, Rep.KosovoKuwaitKyrgyz RepublicLao PDRLatviaLebanonLesothoLiberiaLithuaniaLuxembourgMacedonia, FYRMadagascarMalawiMaldivesMaliMarshall IslandsMauritaniaMauritiusMexicoMicronesia, Fed. Sts.MoldovaMongoliaMontenegroMoroccoMozambiqueNamibiaNepalNetherlandsNew ZealandNicaraguaNigeriaNorwayOmanPakistanPalauPanamaPapua New GuineaParaguayPeruPhilippinesPolandPortugalRomaniaRussian FederationRwandaSao Tome and PrincipeSenegalSerbiaSeychellesSierra LeoneSingaporeSlovak RepublicSloveniaSolomon IslandsSomaliaSouth AfricaSpainSri LankaSt. Kitts and NevisSt. LuciaSt. Vincent and the GrenadinesSudanSurinameSwazilandSwedenSwitzerlandSyrian Arab RepublicTajikistanTanzaniaThailandTimor-LesteTongaTrinidad and TobagoTunisiaTurkeyTurkmenistanTuvaluUgandaUkraineUnited Arab EmiratesUnited KingdomUnited StatesUruguayUzbekistanVanuatuVenezuela, RBVietnamWest Bank and GazaZambiaZimbabwe Timeline:
This timeline shows a graph from 1961 to 1991 of Somalia. No data until 1960. Number of actual observations by date: 31.
Source name:
World Development Indicators
Source organization:
World Bank national accounts data, and OECD National Accounts data files.
Categories, topics:
Economy & Growth
Last updated:
apr 23, 2017
Indicators value changes by year
Minimum:
42.364 bln
jan 1, 1975
Maximum:
90.805 bln
jan 1, 1989
At the date of observation
Value
Absolute change
Change from previous value
jan 1, 1961
45.525 bln
+45.525 bln
0.0%
jan 1, 1962
44.045 bln
-1.481 bln
-3.25%
jan 1, 1963
47.144 bln
+3.099 bln
7.04%
jan 1, 1964
48.472 bln
+1.328 bln
2.82%
jan 1, 1965
45.492 bln
-2.98 bln
-6.15%
jan 1, 1966
42.477 bln
-3.015 bln
-6.63%
jan 1, 1967
46.341 bln
+3.864 bln
9.1%
jan 1, 1968
49.094 bln
+2.753 bln
5.94%
jan 1, 1969
49.45 bln
+356.098 mln
0.73%
jan 1, 1970
48.624 bln
-825.598 mln
-1.67%
jan 1, 1971
50.629 bln
+2.005 bln
4.12%
jan 1, 1972
51.248 bln
+618.303 mln
1.22%
jan 1, 1973
55.817 bln
+4.569 bln
8.92%
jan 1, 1974
54.361 bln
-1.456 bln
-2.61%
jan 1, 1975
42.364 bln
-11.998 bln
-22.07%
jan 1, 1976
58.072 bln
+15.708 bln
37.08%
jan 1, 1977
57.869 bln
-202.699 mln
-0.35%
jan 1, 1978
72.22 bln
+14.351 bln
24.8%
jan 1, 1979
70.124 bln
-2.096 bln
-2.9%
jan 1, 1980
69.042 bln
-1.082 bln
-1.54%
jan 1, 1981
73.13 bln
+4.088 bln
5.92%
jan 1, 1982
75.51 bln
+2.38 bln
3.25%
jan 1, 1983
79.471 bln
+3.961 bln
5.25%
jan 1, 1984
71.441 bln
-8.03 bln
-10.1%
jan 1, 1985
77.484 bln
+6.043 bln
8.46%
jan 1, 1986
83.262 bln
+5.778 bln
7.46%
jan 1, 1987
84.9 bln
+1.638 bln
1.97%
jan 1, 1988
90.734 bln
+5.834 bln
6.87%
jan 1, 1989
90.805 bln
+70.975 mln
0.08%
jan 1, 1990
89.997 bln
-808.002 mln
-0.89%
jan 1, 1991
88.963 bln
-1.034 bln
-1.15%
Ranking of countries by current statistics by years


Comments: