29
/
en
AIzaSyAYiBZKx7MnpbEhh9jyipgxe19OcubqV5w
April 1, 2024
237176
Serbia
SRB
true
2
1
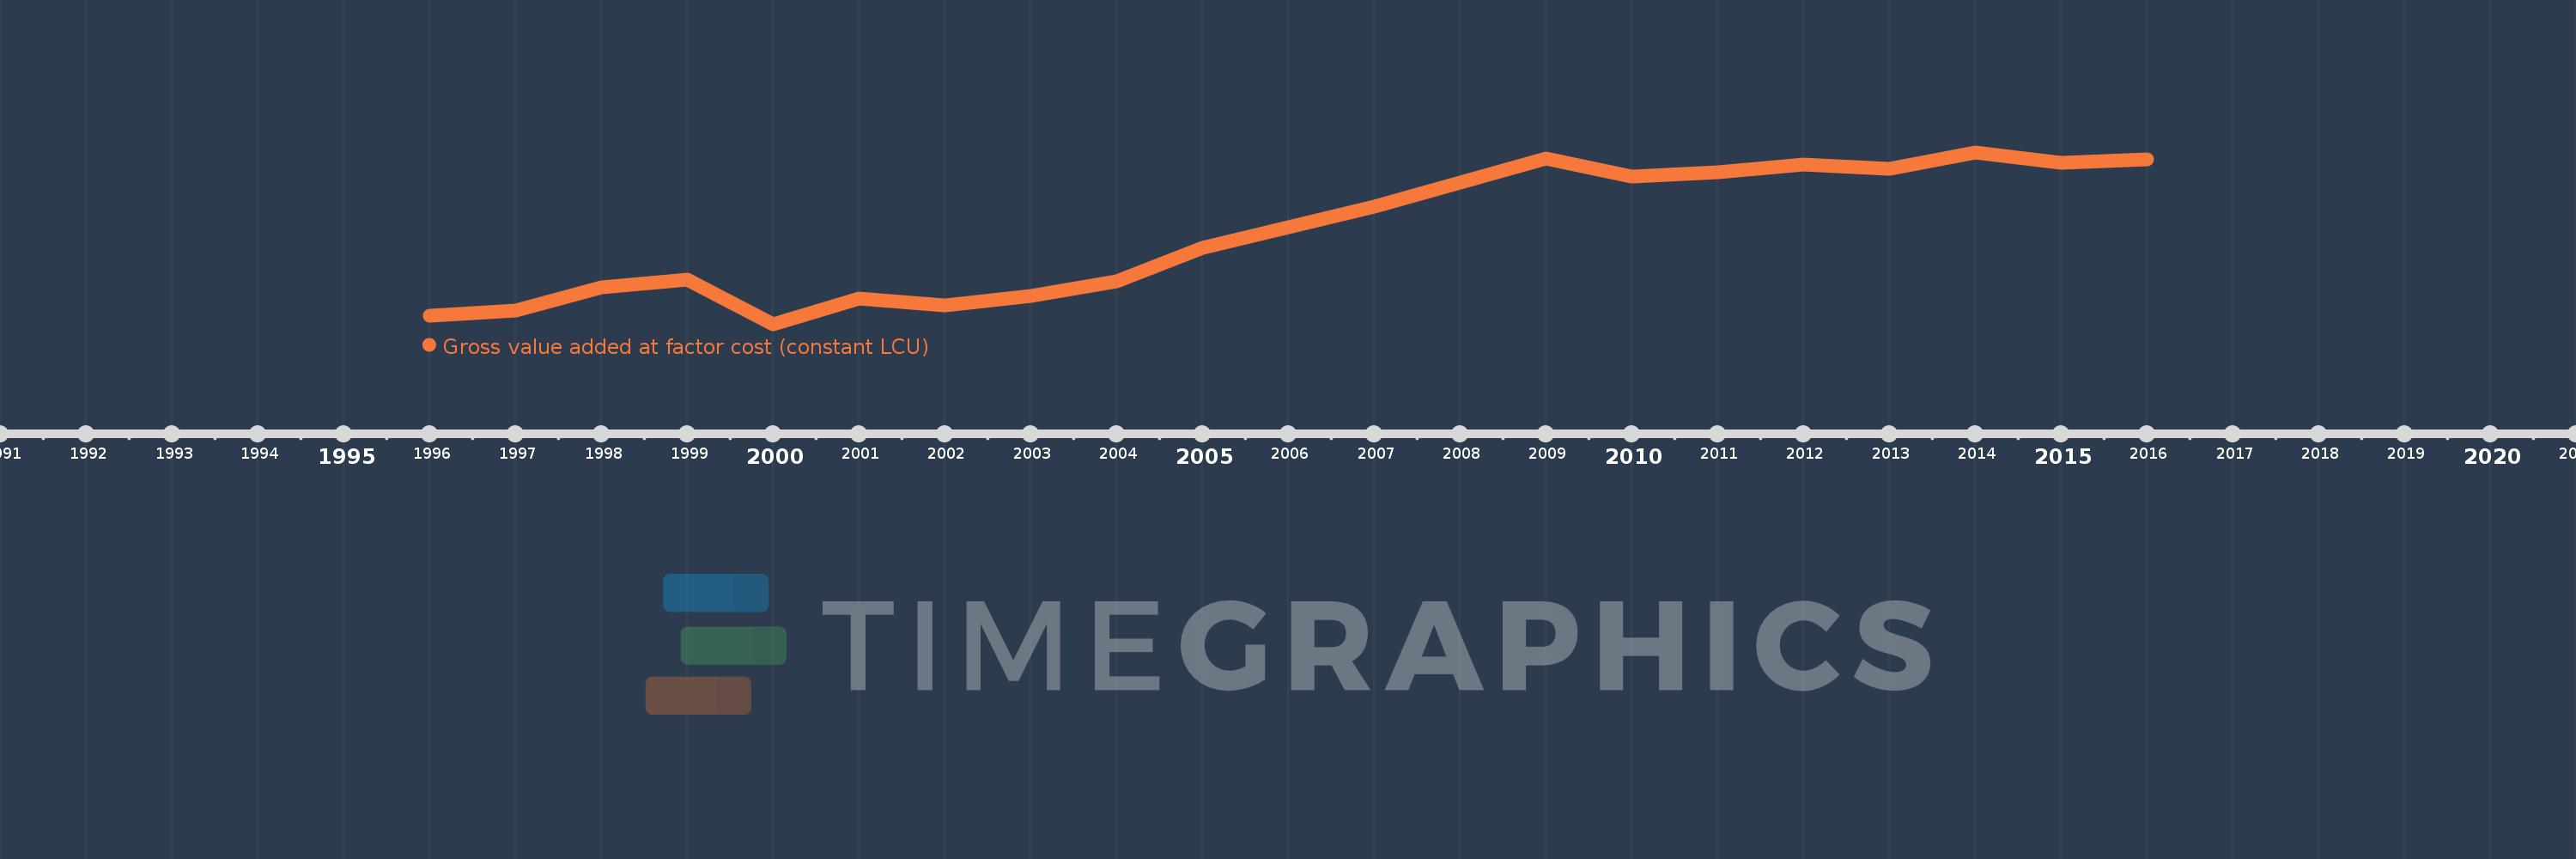
Gross value added at factor cost (constant LCU)
2016,2015,2014,2013,2012,2011,2010,2009,2008,2007,2006,2005,2004,2003,2002,2001,2000,1999,1998,1997,1996
This statistics in other country:
AfghanistanAlbaniaAlgeriaAntigua and BarbudaArgentinaArmeniaAustraliaAustriaAzerbaijanBahamas, TheBangladeshBelarusBelgiumBelizeBeninBermudaBhutanBoliviaBosnia and HerzegovinaBotswanaBrazilBulgariaBurkina FasoBurundiCabo VerdeCambodiaCameroonCanadaCayman IslandsCentral African RepublicChadChileColombiaCongo, Dem. Rep.Costa RicaCote d'IvoireCroatiaCubaCyprusCzech RepublicDenmarkDjiboutiDominicaDominican RepublicEcuadorEgypt, Arab Rep.El SalvadorEquatorial GuineaEritreaEstoniaEthiopiaFijiFinlandFranceGabonGambia, TheGeorgiaGermanyGhanaGreeceGrenadaGuatemalaGuineaGuinea-BissauGuyanaHaitiHondurasHong Kong SAR, ChinaHungaryIcelandIndiaIndonesiaIran, Islamic Rep.IrelandItalyJamaicaJapanJordanKazakhstanKenyaKiribatiKorea, Rep.KosovoKuwaitKyrgyz RepublicLao PDRLatviaLebanonLesothoLiberiaLithuaniaLuxembourgMacedonia, FYRMadagascarMalawiMaldivesMaliMarshall IslandsMauritaniaMauritiusMexicoMicronesia, Fed. Sts.MoldovaMongoliaMontenegroMoroccoMozambiqueNamibiaNepalNetherlandsNew ZealandNicaraguaNigeriaNorwayOmanPakistanPalauPanamaPapua New GuineaParaguayPeruPhilippinesPolandPortugalRomaniaRussian FederationRwandaSao Tome and PrincipeSenegalSerbiaSeychellesSierra LeoneSingaporeSlovak RepublicSloveniaSolomon IslandsSomaliaSouth AfricaSpainSri LankaSt. Kitts and NevisSt. LuciaSt. Vincent and the GrenadinesSudanSurinameSwazilandSwedenSwitzerlandSyrian Arab RepublicTajikistanTanzaniaThailandTimor-LesteTongaTrinidad and TobagoTunisiaTurkeyTurkmenistanTuvaluUgandaUkraineUnited Arab EmiratesUnited KingdomUnited StatesUruguayUzbekistanVanuatuVenezuela, RBVietnamWest Bank and GazaZambiaZimbabwe Timeline:
This timeline shows a graph from 1996 to 2016 of Serbia. No data until 1995. Number of actual observations by date: 21.
Source name:
World Development Indicators
Source organization:
World Bank national accounts data, and OECD National Accounts data files.
Categories, topics:
Economy & Growth
Last updated:
apr 23, 2017
Indicators value changes by year
Minimum:
1.78 trl
jan 1, 2000
Maximum:
2.658 trl
jan 1, 2014
At the date of observation
Value
Absolute change
Change from previous value
jan 1, 1996
1.824 trl
+1.824 trl
0.0%
jan 1, 1997
1.849 trl
+25.371 bln
1.39%
jan 1, 1998
1.968 trl
+119.17 bln
6.45%
jan 1, 1999
2.009 trl
+41.131 bln
2.09%
jan 1, 2000
1.78 trl
-229.289 bln
-11.41%
jan 1, 2001
1.913 trl
+132.776 bln
7.46%
jan 1, 2002
1.876 trl
-36.353 bln
-1.9%
jan 1, 2003
1.924 trl
+47.264 bln
2.52%
jan 1, 2004
2.001 trl
+76.864 bln
4.0%
jan 1, 2005
2.172 trl
+171.192 bln
8.56%
jan 1, 2006
2.277 trl
+105.152 bln
4.84%
jan 1, 2007
2.379 trl
+102.364 bln
4.5%
jan 1, 2008
2.506 trl
+127.055 bln
5.34%
jan 1, 2009
2.628 trl
+121.496 bln
4.85%
jan 1, 2010
2.537 trl
-90.633 bln
-3.45%
jan 1, 2011
2.557 trl
+20.227 bln
0.8%
jan 1, 2012
2.595 trl
+37.418 bln
1.46%
jan 1, 2013
2.574 trl
-20.758 bln
-0.8%
jan 1, 2014
2.658 trl
+84.448 bln
3.28%
jan 1, 2015
2.605 trl
-53.89 bln
-2.03%
jan 1, 2016
2.624 trl
+19.067 bln
0.73%
Ranking of countries by current statistics by years


Comments: