29
/
en
AIzaSyAYiBZKx7MnpbEhh9jyipgxe19OcubqV5w
April 1, 2024
229832
Russian Federation
RUS
true
2
1
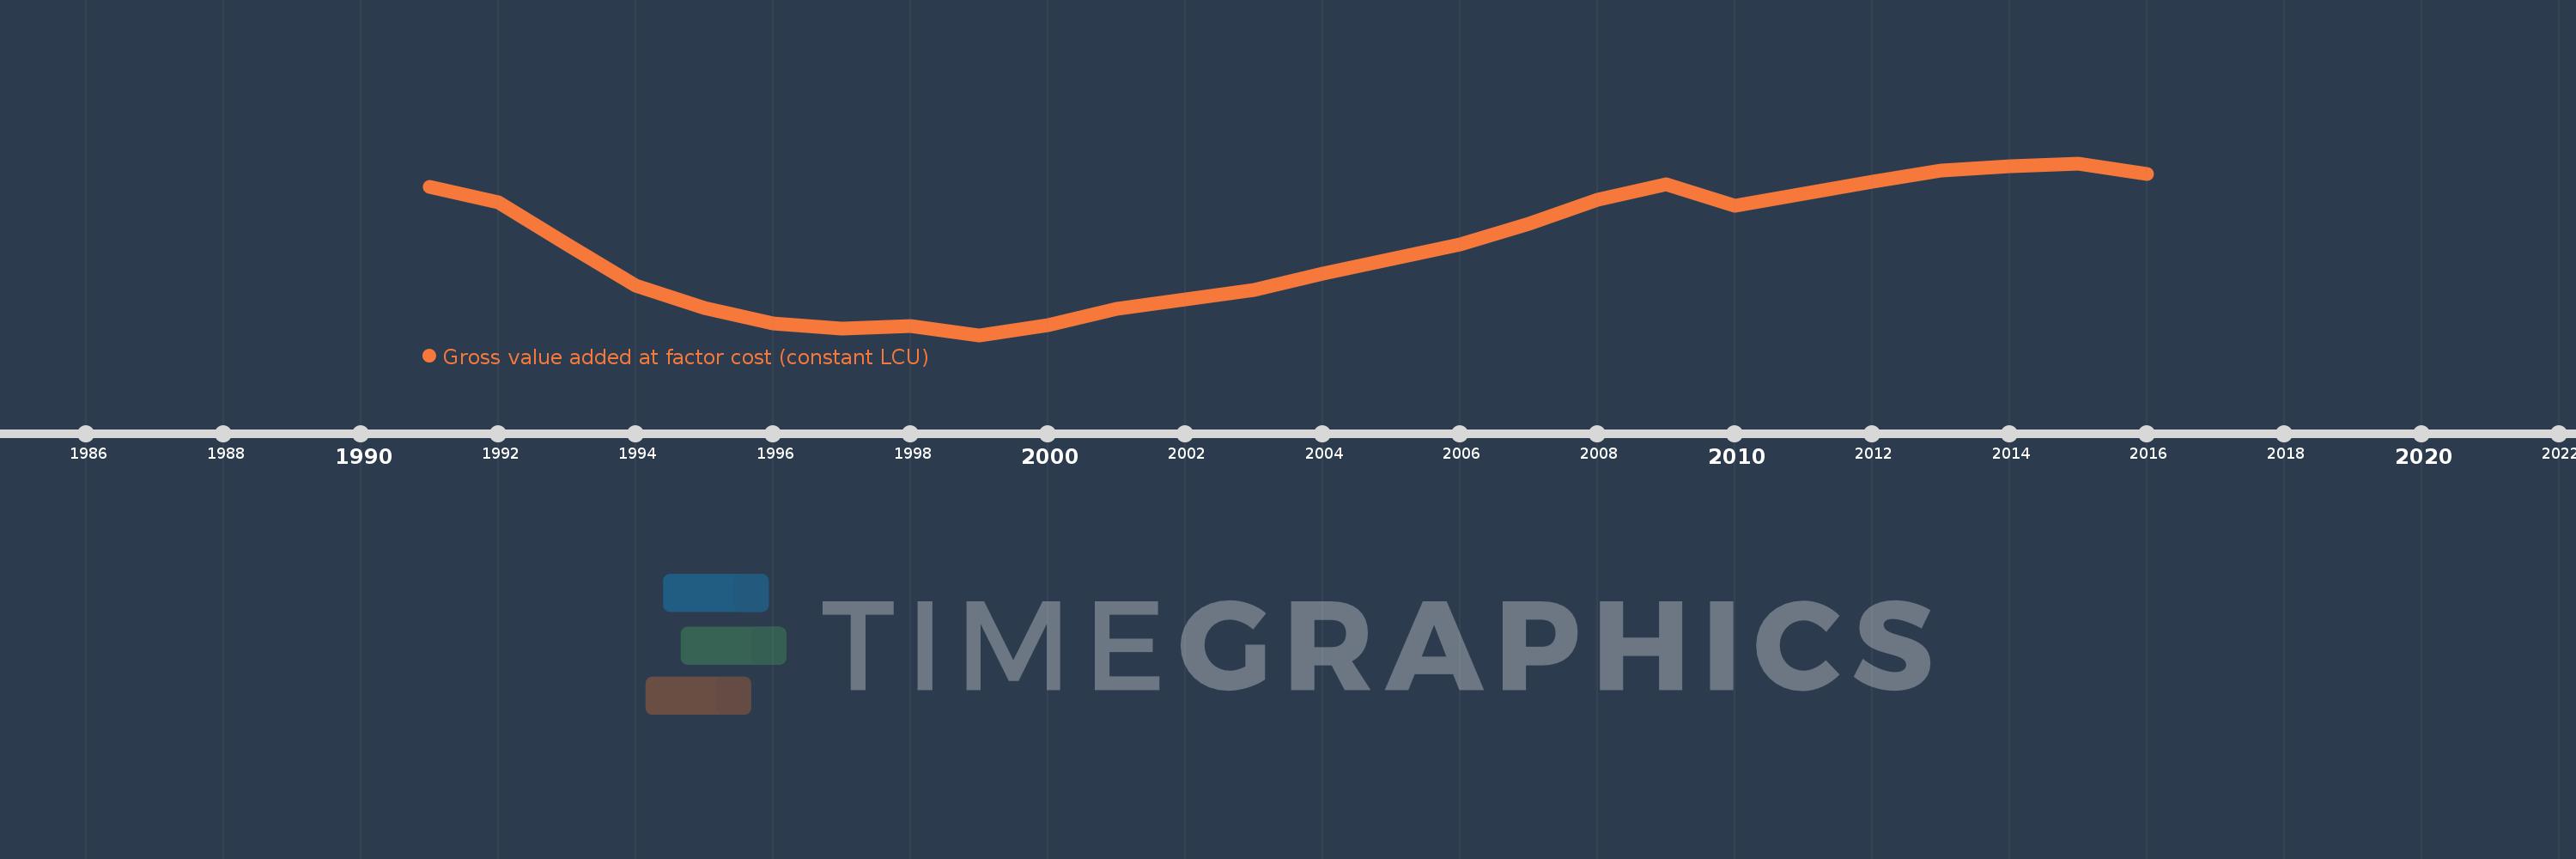
Gross value added at factor cost (constant LCU)
2016,2015,2014,2013,2012,2011,2010,2009,2008,2007,2006,2005,2004,2003,2002,2001,2000,1999,1998,1997,1996,1995,1994,1993,1992,1991
This statistics in other country:
AfghanistanAlbaniaAlgeriaAntigua and BarbudaArgentinaArmeniaAustraliaAustriaAzerbaijanBahamas, TheBangladeshBelarusBelgiumBelizeBeninBermudaBhutanBoliviaBosnia and HerzegovinaBotswanaBrazilBulgariaBurkina FasoBurundiCabo VerdeCambodiaCameroonCanadaCayman IslandsCentral African RepublicChadChileColombiaCongo, Dem. Rep.Costa RicaCote d'IvoireCroatiaCubaCyprusCzech RepublicDenmarkDjiboutiDominicaDominican RepublicEcuadorEgypt, Arab Rep.El SalvadorEquatorial GuineaEritreaEstoniaEthiopiaFijiFinlandFranceGabonGambia, TheGeorgiaGermanyGhanaGreeceGrenadaGuatemalaGuineaGuinea-BissauGuyanaHaitiHondurasHong Kong SAR, ChinaHungaryIcelandIndiaIndonesiaIran, Islamic Rep.IrelandItalyJamaicaJapanJordanKazakhstanKenyaKiribatiKorea, Rep.KosovoKuwaitKyrgyz RepublicLao PDRLatviaLebanonLesothoLiberiaLithuaniaLuxembourgMacedonia, FYRMadagascarMalawiMaldivesMaliMarshall IslandsMauritaniaMauritiusMexicoMicronesia, Fed. Sts.MoldovaMongoliaMontenegroMoroccoMozambiqueNamibiaNepalNetherlandsNew ZealandNicaraguaNigeriaNorwayOmanPakistanPalauPanamaPapua New GuineaParaguayPeruPhilippinesPolandPortugalRomaniaRussian FederationRwandaSao Tome and PrincipeSenegalSerbiaSeychellesSierra LeoneSingaporeSlovak RepublicSloveniaSolomon IslandsSomaliaSouth AfricaSpainSri LankaSt. Kitts and NevisSt. LuciaSt. Vincent and the GrenadinesSudanSurinameSwazilandSwedenSwitzerlandSyrian Arab RepublicTajikistanTanzaniaThailandTimor-LesteTongaTrinidad and TobagoTunisiaTurkeyTurkmenistanTuvaluUgandaUkraineUnited Arab EmiratesUnited KingdomUnited StatesUruguayUzbekistanVanuatuVenezuela, RBVietnamWest Bank and GazaZambiaZimbabwe Timeline:
This timeline shows a graph from 1991 to 2016 of Russian Federation. No data until 1990. Number of actual observations by date: 26.
Source name:
World Development Indicators
Source organization:
World Bank national accounts data, and OECD National Accounts data files.
Categories, topics:
Economy & Growth
Last updated:
apr 23, 2017
Indicators value changes by year
Minimum:
26.931 trl
jan 1, 1999
Maximum:
54.479 trl
jan 1, 2015
At the date of observation
Value
Absolute change
Change from previous value
jan 1, 1991
50.642 trl
+50.642 trl
0.0%
jan 1, 1992
48.267 trl
-2.375 trl
-4.69%
jan 1, 1993
41.493 trl
-6.775 trl
-14.04%
jan 1, 1994
34.792 trl
-6.701 trl
-16.15%
jan 1, 1995
31.286 trl
-3.506 trl
-10.08%
jan 1, 1996
28.783 trl
-2.503 trl
-8.0%
jan 1, 1997
27.986 trl
-797.679 bln
-2.77%
jan 1, 1998
28.38 trl
+394.528 bln
1.41%
jan 1, 1999
26.931 trl
-1.449 trl
-5.1%
jan 1, 2000
28.458 trl
+1.526 trl
5.67%
jan 1, 2001
31.107 trl
+2.65 trl
9.31%
jan 1, 2002
32.634 trl
+1.527 trl
4.91%
jan 1, 2003
34.161 trl
+1.527 trl
4.68%
jan 1, 2004
36.72 trl
+2.559 trl
7.49%
jan 1, 2005
39.145 trl
+2.425 trl
6.6%
jan 1, 2006
41.491 trl
+2.346 trl
5.99%
jan 1, 2007
44.784 trl
+3.293 trl
7.94%
jan 1, 2008
48.564 trl
+3.78 trl
8.44%
jan 1, 2009
51.098 trl
+2.534 trl
5.22%
jan 1, 2010
47.651 trl
-3.447 trl
-6.74%
jan 1, 2011
49.598 trl
+1.947 trl
4.09%
jan 1, 2012
51.5 trl
+1.901 trl
3.83%
jan 1, 2013
53.316 trl
+1.817 trl
3.53%
jan 1, 2014
54.02 trl
+703.493 bln
1.32%
jan 1, 2015
54.479 trl
+459.644 bln
0.85%
jan 1, 2016
52.705 trl
-1.774 trl
-3.26%
Ranking of countries by current statistics by years


Comments: