29
/
en
AIzaSyAYiBZKx7MnpbEhh9jyipgxe19OcubqV5w
April 1, 2024
203001
Mozambique
MOZ
true
2
1
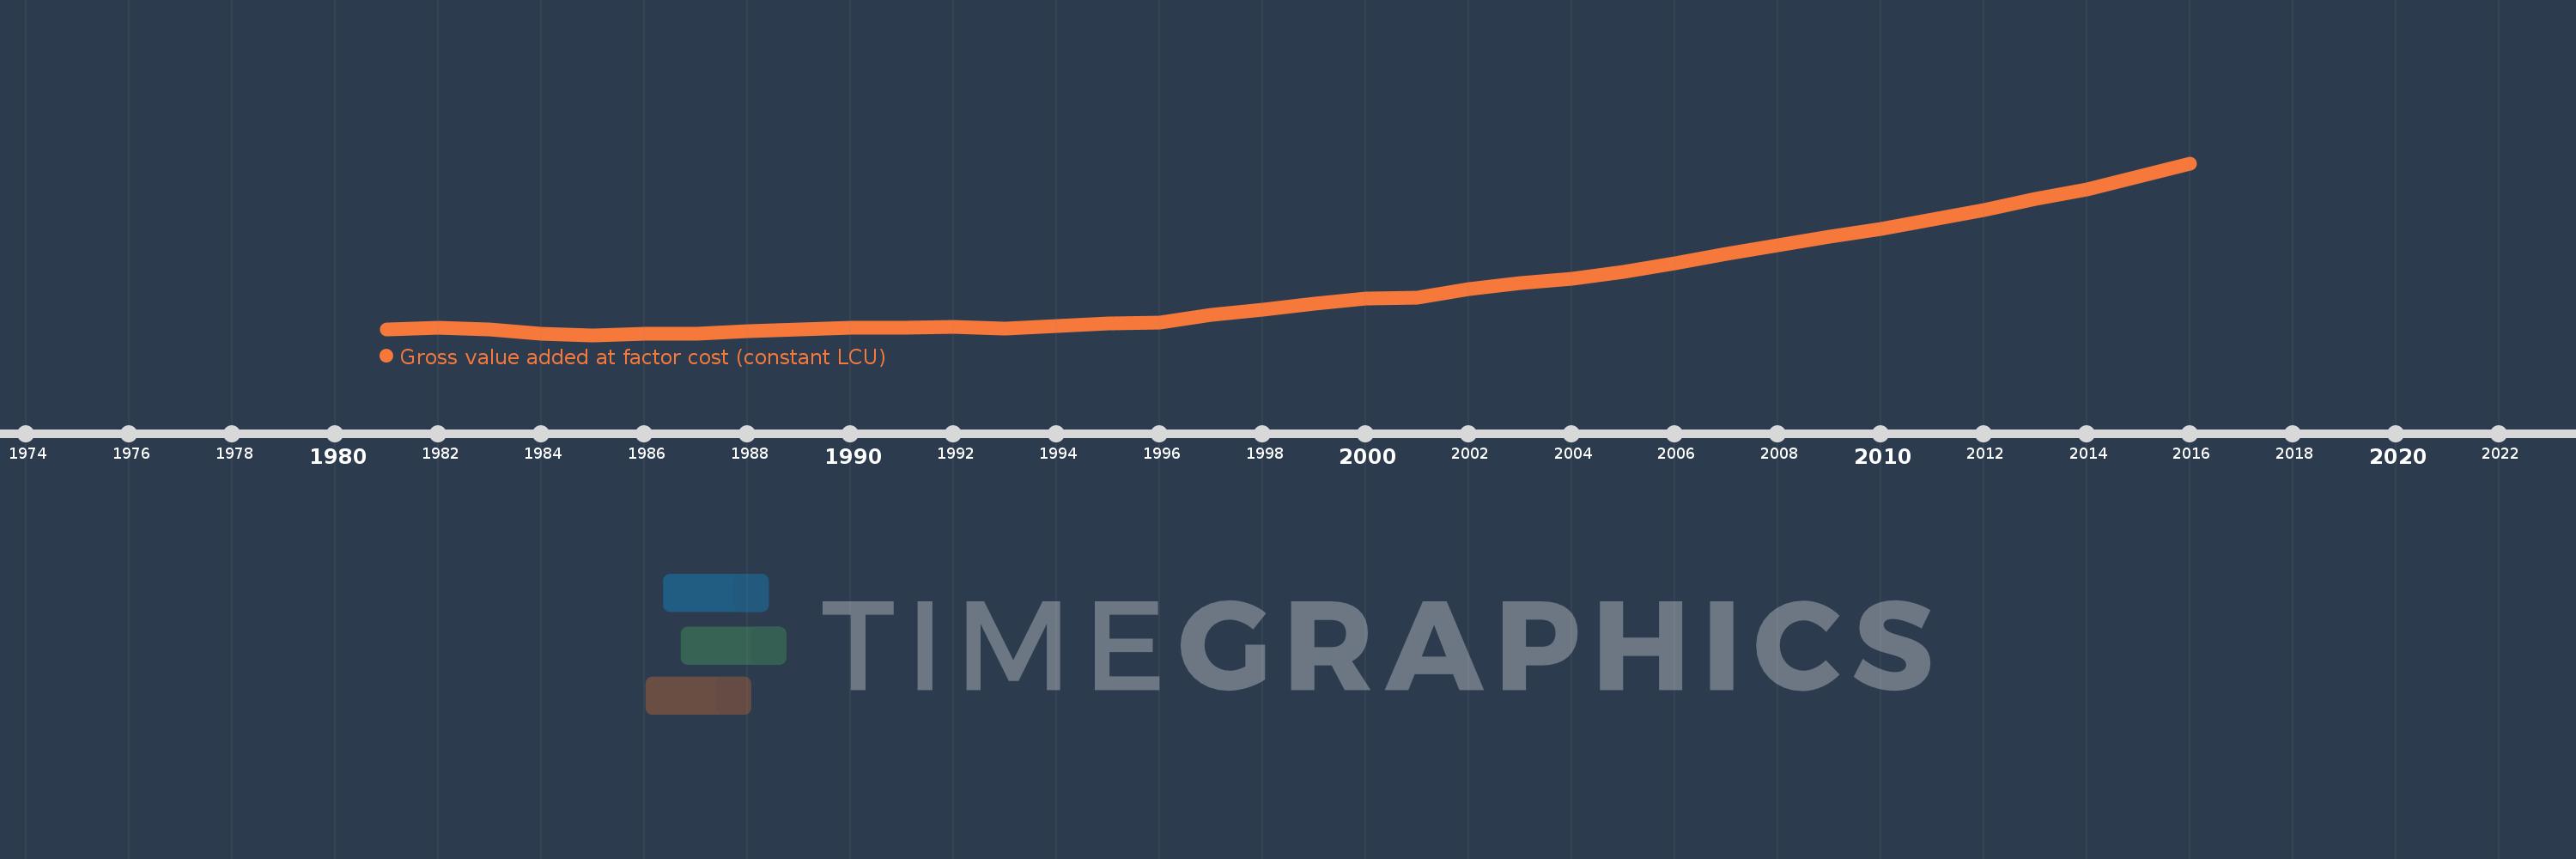
Gross value added at factor cost (constant LCU)
2016,2015,2014,2013,2012,2011,2010,2009,2008,2007,2006,2005,2004,2003,2002,2001,2000,1999,1998,1997,1996,1995,1994,1993,1992,1991,1990,1989,1988,1987,1986,1985,1984,1983,1982,1981
This statistics in other country:
AfghanistanAlbaniaAlgeriaAntigua and BarbudaArgentinaArmeniaAustraliaAustriaAzerbaijanBahamas, TheBangladeshBelarusBelgiumBelizeBeninBermudaBhutanBoliviaBosnia and HerzegovinaBotswanaBrazilBulgariaBurkina FasoBurundiCabo VerdeCambodiaCameroonCanadaCayman IslandsCentral African RepublicChadChileColombiaCongo, Dem. Rep.Costa RicaCote d'IvoireCroatiaCubaCyprusCzech RepublicDenmarkDjiboutiDominicaDominican RepublicEcuadorEgypt, Arab Rep.El SalvadorEquatorial GuineaEritreaEstoniaEthiopiaFijiFinlandFranceGabonGambia, TheGeorgiaGermanyGhanaGreeceGrenadaGuatemalaGuineaGuinea-BissauGuyanaHaitiHondurasHong Kong SAR, ChinaHungaryIcelandIndiaIndonesiaIran, Islamic Rep.IrelandItalyJamaicaJapanJordanKazakhstanKenyaKiribatiKorea, Rep.KosovoKuwaitKyrgyz RepublicLao PDRLatviaLebanonLesothoLiberiaLithuaniaLuxembourgMacedonia, FYRMadagascarMalawiMaldivesMaliMarshall IslandsMauritaniaMauritiusMexicoMicronesia, Fed. Sts.MoldovaMongoliaMontenegroMoroccoMozambiqueNamibiaNepalNetherlandsNew ZealandNicaraguaNigeriaNorwayOmanPakistanPalauPanamaPapua New GuineaParaguayPeruPhilippinesPolandPortugalRomaniaRussian FederationRwandaSao Tome and PrincipeSenegalSerbiaSeychellesSierra LeoneSingaporeSlovak RepublicSloveniaSolomon IslandsSomaliaSouth AfricaSpainSri LankaSt. Kitts and NevisSt. LuciaSt. Vincent and the GrenadinesSudanSurinameSwazilandSwedenSwitzerlandSyrian Arab RepublicTajikistanTanzaniaThailandTimor-LesteTongaTrinidad and TobagoTunisiaTurkeyTurkmenistanTuvaluUgandaUkraineUnited Arab EmiratesUnited KingdomUnited StatesUruguayUzbekistanVanuatuVenezuela, RBVietnamWest Bank and GazaZambiaZimbabwe Timeline:
This timeline shows a graph from 1981 to 2016 of Mozambique. No data until 1980. Number of actual observations by date: 36.
Source name:
World Development Indicators
Source organization:
World Bank national accounts data, and OECD National Accounts data files.
Categories, topics:
Economy & Growth
Last updated:
apr 23, 2017
Indicators value changes by year
Minimum:
57.488 bln
jan 1, 1985
Maximum:
414.897 bln
jan 1, 2016
At the date of observation
Value
Absolute change
Change from previous value
jan 1, 1981
68.871 bln
+68.871 bln
0.0%
jan 1, 1982
73.007 bln
+4.136 bln
6.01%
jan 1, 1983
69.715 bln
-3.292 bln
-4.51%
jan 1, 1984
59.908 bln
-9.807 bln
-14.07%
jan 1, 1985
57.488 bln
-2.42 bln
-4.04%
jan 1, 1986
60.646 bln
+3.158 bln
5.49%
jan 1, 1987
59.896 bln
-750.184 mln
-1.24%
jan 1, 1988
65.201 bln
+5.305 bln
8.86%
jan 1, 1989
69.747 bln
+4.546 bln
6.97%
jan 1, 1990
72.676 bln
+2.929 bln
4.2%
jan 1, 1991
73.548 bln
+872.009 mln
1.2%
jan 1, 1992
73.601 bln
+53.648 mln
0.07%
jan 1, 1993
70.155 bln
-3.446 bln
-4.68%
jan 1, 1994
76.481 bln
+6.325 bln
9.02%
jan 1, 1995
81.195 bln
+4.714 bln
6.16%
jan 1, 1996
83.049 bln
+1.854 bln
2.28%
jan 1, 1997
99.722 bln
+16.673 bln
20.08%
jan 1, 1998
110.478 bln
+10.756 bln
10.79%
jan 1, 1999
123.331 bln
+12.853 bln
11.63%
jan 1, 2000
133.507 bln
+10.177 bln
8.25%
jan 1, 2001
135.115 bln
+1.608 bln
1.2%
jan 1, 2002
153.419 bln
+18.304 bln
13.55%
jan 1, 2003
164.809 bln
+11.39 bln
7.42%
jan 1, 2004
174.946 bln
+10.137 bln
6.15%
jan 1, 2005
189.218 bln
+14.272 bln
8.16%
jan 1, 2006
206.428 bln
+17.21 bln
9.1%
jan 1, 2007
226.983 bln
+20.555 bln
9.96%
jan 1, 2008
244.416 bln
+17.433 bln
7.68%
jan 1, 2009
261.465 bln
+17.049 bln
6.98%
jan 1, 2010
278.597 bln
+17.132 bln
6.55%
jan 1, 2011
298.319 bln
+19.722 bln
7.08%
jan 1, 2012
317.963 bln
+19.643 bln
6.58%
jan 1, 2013
340.864 bln
+22.901 bln
7.2%
jan 1, 2014
361.158 bln
+20.294 bln
5.95%
jan 1, 2015
387.805 bln
+26.647 bln
7.38%
jan 1, 2016
414.897 bln
+27.091 bln
6.99%
Ranking of countries by current statistics by years


Comments: