29
/
en
AIzaSyAYiBZKx7MnpbEhh9jyipgxe19OcubqV5w
April 1, 2024
283691
West Bank and Gaza
PSE
true
2
1
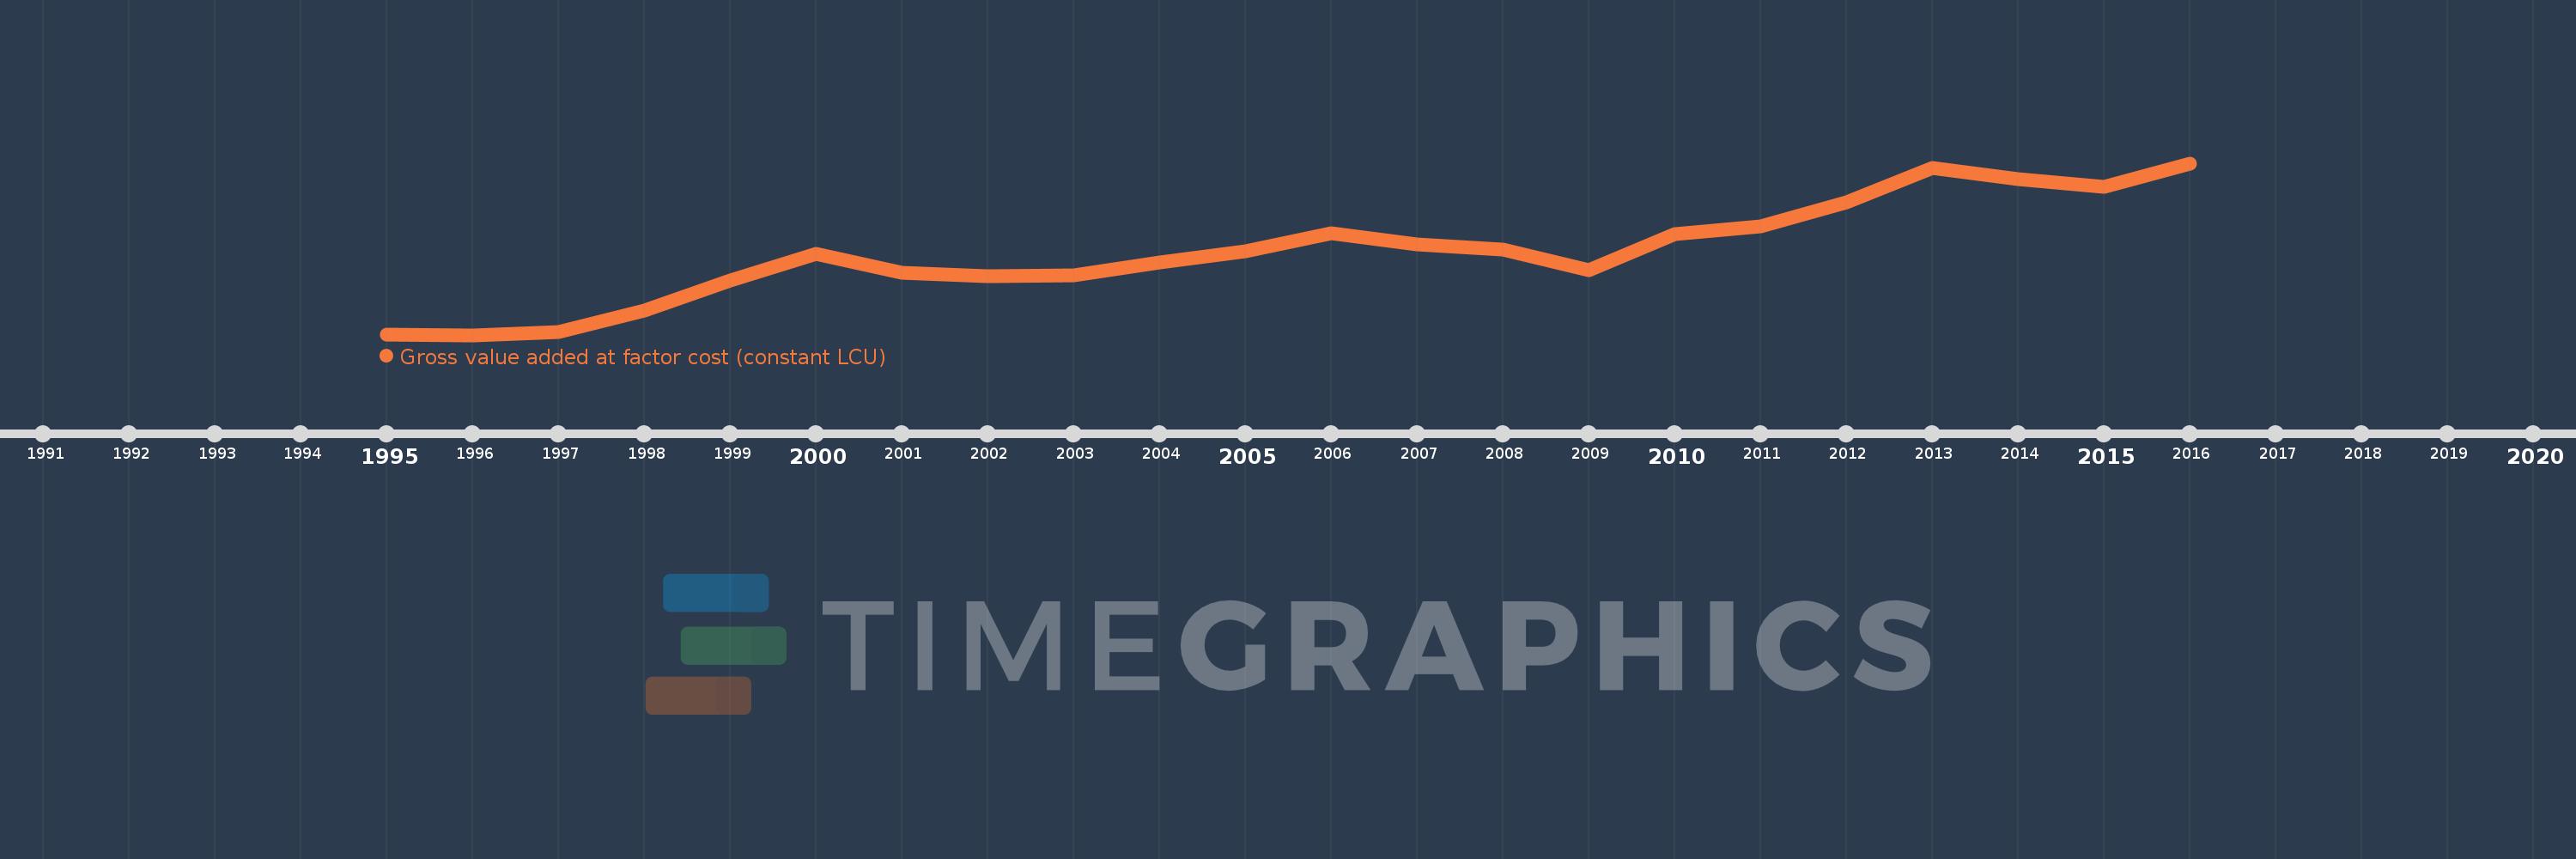
Gross value added at factor cost (constant LCU)
2016,2015,2014,2013,2012,2011,2010,2009,2008,2007,2006,2005,2004,2003,2002,2001,2000,1999,1998,1997,1996,1995
This statistics in other country:
AfghanistanAlbaniaAlgeriaAntigua and BarbudaArgentinaArmeniaAustraliaAustriaAzerbaijanBahamas, TheBangladeshBelarusBelgiumBelizeBeninBermudaBhutanBoliviaBosnia and HerzegovinaBotswanaBrazilBulgariaBurkina FasoBurundiCabo VerdeCambodiaCameroonCanadaCayman IslandsCentral African RepublicChadChileColombiaCongo, Dem. Rep.Costa RicaCote d'IvoireCroatiaCubaCyprusCzech RepublicDenmarkDjiboutiDominicaDominican RepublicEcuadorEgypt, Arab Rep.El SalvadorEquatorial GuineaEritreaEstoniaEthiopiaFijiFinlandFranceGabonGambia, TheGeorgiaGermanyGhanaGreeceGrenadaGuatemalaGuineaGuinea-BissauGuyanaHaitiHondurasHong Kong SAR, ChinaHungaryIcelandIndiaIndonesiaIran, Islamic Rep.IrelandItalyJamaicaJapanJordanKazakhstanKenyaKiribatiKorea, Rep.KosovoKuwaitKyrgyz RepublicLao PDRLatviaLebanonLesothoLiberiaLithuaniaLuxembourgMacedonia, FYRMadagascarMalawiMaldivesMaliMarshall IslandsMauritaniaMauritiusMexicoMicronesia, Fed. Sts.MoldovaMongoliaMontenegroMoroccoMozambiqueNamibiaNepalNetherlandsNew ZealandNicaraguaNigeriaNorwayOmanPakistanPalauPanamaPapua New GuineaParaguayPeruPhilippinesPolandPortugalRomaniaRussian FederationRwandaSao Tome and PrincipeSenegalSerbiaSeychellesSierra LeoneSingaporeSlovak RepublicSloveniaSolomon IslandsSomaliaSouth AfricaSpainSri LankaSt. Kitts and NevisSt. LuciaSt. Vincent and the GrenadinesSudanSurinameSwazilandSwedenSwitzerlandSyrian Arab RepublicTajikistanTanzaniaThailandTimor-LesteTongaTrinidad and TobagoTunisiaTurkeyTurkmenistanTuvaluUgandaUkraineUnited Arab EmiratesUnited KingdomUnited StatesUruguayUzbekistanVanuatuVenezuela, RBVietnamWest Bank and GazaZambiaZimbabwe Timeline:
This timeline shows a graph from 1995 to 2016 of West Bank and Gaza. No data until 1994. Number of actual observations by date: 22.
Source name:
World Development Indicators
Source organization:
World Bank national accounts data, and OECD National Accounts data files.
Categories, topics:
Economy & Growth
Last updated:
apr 23, 2017
Indicators value changes by year
Minimum:
9.174 bln
jan 1, 1996
Maximum:
25.3 bln
jan 1, 2016
At the date of observation
Value
Absolute change
Change from previous value
jan 1, 1995
9.213 bln
+9.213 bln
0.0%
jan 1, 1996
9.174 bln
-39.137 mln
-0.42%
jan 1, 1997
9.496 bln
+322.322 mln
3.51%
jan 1, 1998
11.476 bln
+1.98 bln
20.85%
jan 1, 1999
14.323 bln
+2.846 bln
24.8%
jan 1, 2000
16.82 bln
+2.497 bln
17.44%
jan 1, 2001
15.03 bln
-1.79 bln
-10.64%
jan 1, 2002
14.662 bln
-367.819 mln
-2.45%
jan 1, 2003
14.813 bln
+150.4 mln
1.03%
jan 1, 2004
16.006 bln
+1.194 bln
8.06%
jan 1, 2005
17.041 bln
+1.035 bln
6.46%
jan 1, 2006
18.701 bln
+1.66 bln
9.74%
jan 1, 2007
17.702 bln
-999.587 mln
-5.35%
jan 1, 2008
17.169 bln
-532.164 mln
-3.01%
jan 1, 2009
15.272 bln
-1.897 bln
-11.05%
jan 1, 2010
18.609 bln
+3.337 bln
21.85%
jan 1, 2011
19.365 bln
+756.048 mln
4.06%
jan 1, 2012
21.623 bln
+2.259 bln
11.66%
jan 1, 2013
24.844 bln
+3.22 bln
14.89%
jan 1, 2014
23.826 bln
-1.018 bln
-4.1%
jan 1, 2015
23.064 bln
-762.363 mln
-3.2%
jan 1, 2016
25.3 bln
+2.237 bln
9.7%
Ranking of countries by current statistics by years


Comments: