29
/
en
AIzaSyAYiBZKx7MnpbEhh9jyipgxe19OcubqV5w
April 1, 2024
273664
Ukraine
UKR
true
2
1
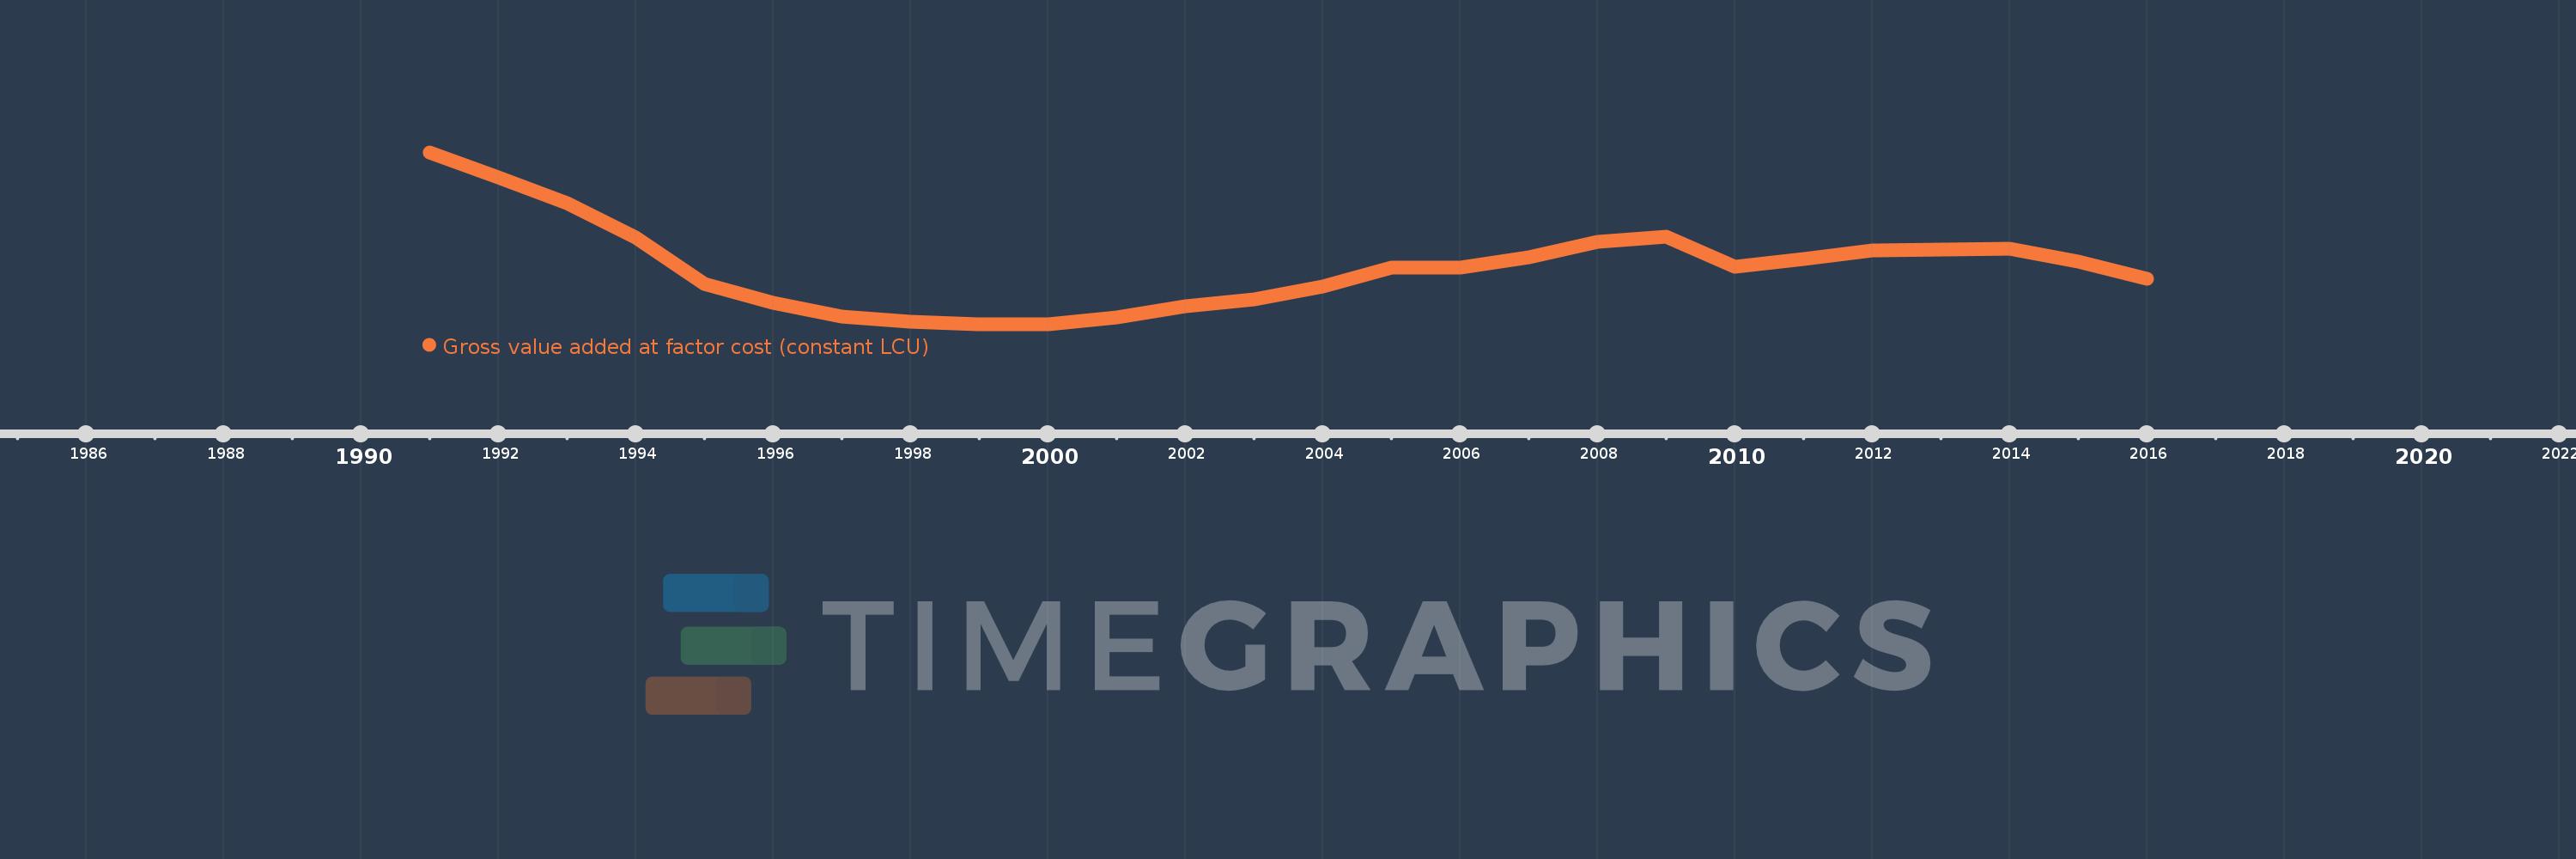
Gross value added at factor cost (constant LCU)
2016,2015,2014,2013,2012,2011,2010,2009,2008,2007,2006,2005,2004,2003,2002,2001,2000,1999,1998,1997,1996,1995,1994,1993,1992,1991
This statistics in other country:
AfghanistanAlbaniaAlgeriaAntigua and BarbudaArgentinaArmeniaAustraliaAustriaAzerbaijanBahamas, TheBangladeshBelarusBelgiumBelizeBeninBermudaBhutanBoliviaBosnia and HerzegovinaBotswanaBrazilBulgariaBurkina FasoBurundiCabo VerdeCambodiaCameroonCanadaCayman IslandsCentral African RepublicChadChileColombiaCongo, Dem. Rep.Costa RicaCote d'IvoireCroatiaCubaCyprusCzech RepublicDenmarkDjiboutiDominicaDominican RepublicEcuadorEgypt, Arab Rep.El SalvadorEquatorial GuineaEritreaEstoniaEthiopiaFijiFinlandFranceGabonGambia, TheGeorgiaGermanyGhanaGreeceGrenadaGuatemalaGuineaGuinea-BissauGuyanaHaitiHondurasHong Kong SAR, ChinaHungaryIcelandIndiaIndonesiaIran, Islamic Rep.IrelandItalyJamaicaJapanJordanKazakhstanKenyaKiribatiKorea, Rep.KosovoKuwaitKyrgyz RepublicLao PDRLatviaLebanonLesothoLiberiaLithuaniaLuxembourgMacedonia, FYRMadagascarMalawiMaldivesMaliMarshall IslandsMauritaniaMauritiusMexicoMicronesia, Fed. Sts.MoldovaMongoliaMontenegroMoroccoMozambiqueNamibiaNepalNetherlandsNew ZealandNicaraguaNigeriaNorwayOmanPakistanPalauPanamaPapua New GuineaParaguayPeruPhilippinesPolandPortugalRomaniaRussian FederationRwandaSao Tome and PrincipeSenegalSerbiaSeychellesSierra LeoneSingaporeSlovak RepublicSloveniaSolomon IslandsSomaliaSouth AfricaSpainSri LankaSt. Kitts and NevisSt. LuciaSt. Vincent and the GrenadinesSudanSurinameSwazilandSwedenSwitzerlandSyrian Arab RepublicTajikistanTanzaniaThailandTimor-LesteTongaTrinidad and TobagoTunisiaTurkeyTurkmenistanTuvaluUgandaUkraineUnited Arab EmiratesUnited KingdomUnited StatesUruguayUzbekistanVanuatuVenezuela, RBVietnamWest Bank and GazaZambiaZimbabwe Timeline:
This timeline shows a graph from 1991 to 2016 of Ukraine. No data until 1990. Number of actual observations by date: 26.
Source name:
World Development Indicators
Source organization:
World Bank national accounts data, and OECD National Accounts data files.
Categories, topics:
Economy & Growth
Last updated:
apr 23, 2017
Indicators value changes by year
Minimum:
609.51 bln
jan 1, 2000
Maximum:
1.521 trl
jan 1, 1991
At the date of observation
Value
Absolute change
Change from previous value
jan 1, 1991
1.521 trl
+1.521 trl
0.0%
jan 1, 1992
1.388 trl
-133.889 bln
-8.8%
jan 1, 1993
1.253 trl
-134.595 bln
-9.7%
jan 1, 1994
1.07 trl
-182.936 bln
-14.6%
jan 1, 1995
825.008 bln
-245.041 bln
-22.9%
jan 1, 1996
724.357 bln
-100.651 bln
-12.2%
jan 1, 1997
651.197 bln
-73.16 bln
-10.1%
jan 1, 1998
623.195 bln
-28.001 bln
-4.3%
jan 1, 1999
610.731 bln
-12.464 bln
-2.0%
jan 1, 2000
609.51 bln
-1.221 bln
-0.2%
jan 1, 2001
645.471 bln
+35.961 bln
5.9%
jan 1, 2002
704.854 bln
+59.383 bln
9.2%
jan 1, 2003
741.507 bln
+36.652 bln
5.2%
jan 1, 2004
811.208 bln
+69.702 bln
9.4%
jan 1, 2005
908.815 bln
+97.607 bln
12.03%
jan 1, 2006
908.575 bln
-239.96 mln
-0.03%
jan 1, 2007
966.724 bln
+58.149 bln
6.4%
jan 1, 2008
1.048 trl
+81.205 bln
8.4%
jan 1, 2009
1.072 trl
+24.102 bln
2.3%
jan 1, 2010
913.37 bln
-158.661 bln
-14.8%
jan 1, 2011
954.472 bln
+41.102 bln
4.5%
jan 1, 2012
1.001 trl
+46.549 bln
4.88%
jan 1, 2013
1.006 trl
+4.867 bln
0.49%
jan 1, 2014
1.01 trl
+4.339 bln
0.43%
jan 1, 2015
942.805 bln
-67.422 bln
-6.67%
jan 1, 2016
848.841 bln
-93.964 bln
-9.97%
Ranking of countries by current statistics by years


Comments: