29
/
en
AIzaSyAYiBZKx7MnpbEhh9jyipgxe19OcubqV5w
April 1, 2024
199222
Mongolia
MNG
true
2
1
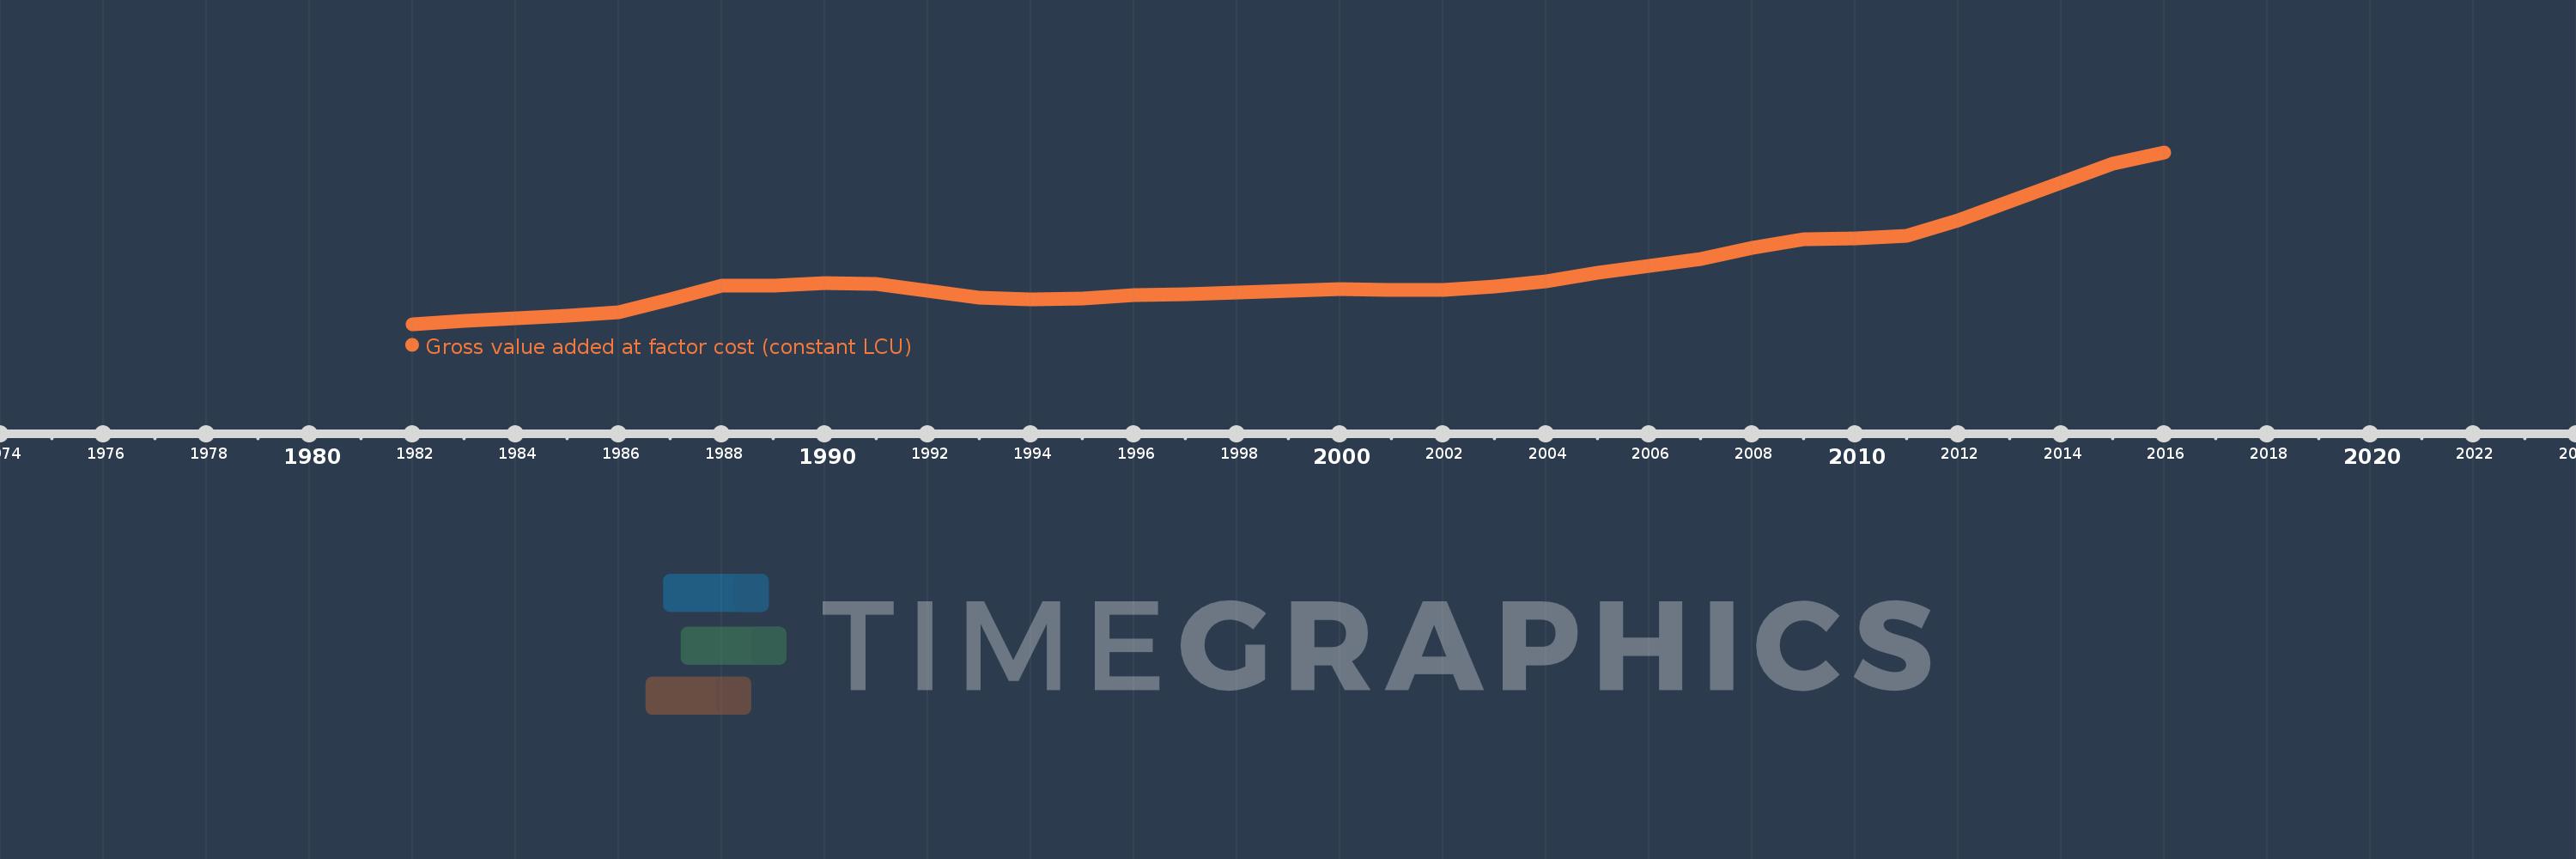
Gross value added at factor cost (constant LCU)
2016,2015,2014,2013,2012,2011,2010,2009,2008,2007,2006,2005,2004,2003,2002,2001,2000,1999,1998,1997,1996,1995,1994,1993,1992,1991,1990,1989,1988,1987,1986,1985,1984,1983,1982
This statistics in other country:
AfghanistanAlbaniaAlgeriaAntigua and BarbudaArgentinaArmeniaAustraliaAustriaAzerbaijanBahamas, TheBangladeshBelarusBelgiumBelizeBeninBermudaBhutanBoliviaBosnia and HerzegovinaBotswanaBrazilBulgariaBurkina FasoBurundiCabo VerdeCambodiaCameroonCanadaCayman IslandsCentral African RepublicChadChileColombiaCongo, Dem. Rep.Costa RicaCote d'IvoireCroatiaCubaCyprusCzech RepublicDenmarkDjiboutiDominicaDominican RepublicEcuadorEgypt, Arab Rep.El SalvadorEquatorial GuineaEritreaEstoniaEthiopiaFijiFinlandFranceGabonGambia, TheGeorgiaGermanyGhanaGreeceGrenadaGuatemalaGuineaGuinea-BissauGuyanaHaitiHondurasHong Kong SAR, ChinaHungaryIcelandIndiaIndonesiaIran, Islamic Rep.IrelandItalyJamaicaJapanJordanKazakhstanKenyaKiribatiKorea, Rep.KosovoKuwaitKyrgyz RepublicLao PDRLatviaLebanonLesothoLiberiaLithuaniaLuxembourgMacedonia, FYRMadagascarMalawiMaldivesMaliMarshall IslandsMauritaniaMauritiusMexicoMicronesia, Fed. Sts.MoldovaMongoliaMontenegroMoroccoMozambiqueNamibiaNepalNetherlandsNew ZealandNicaraguaNigeriaNorwayOmanPakistanPalauPanamaPapua New GuineaParaguayPeruPhilippinesPolandPortugalRomaniaRussian FederationRwandaSao Tome and PrincipeSenegalSerbiaSeychellesSierra LeoneSingaporeSlovak RepublicSloveniaSolomon IslandsSomaliaSouth AfricaSpainSri LankaSt. Kitts and NevisSt. LuciaSt. Vincent and the GrenadinesSudanSurinameSwazilandSwedenSwitzerlandSyrian Arab RepublicTajikistanTanzaniaThailandTimor-LesteTongaTrinidad and TobagoTunisiaTurkeyTurkmenistanTuvaluUgandaUkraineUnited Arab EmiratesUnited KingdomUnited StatesUruguayUzbekistanVanuatuVenezuela, RBVietnamWest Bank and GazaZambiaZimbabwe Timeline:
This timeline shows a graph from 1982 to 2016 of Mongolia. No data until 1981. Number of actual observations by date: 35.
Source name:
World Development Indicators
Source organization:
World Bank national accounts data, and OECD National Accounts data files.
Categories, topics:
Economy & Growth
Last updated:
apr 23, 2017
Indicators value changes by year
Minimum:
2.65 trl
jan 1, 1982
Maximum:
14.47 trl
jan 1, 2016
At the date of observation
Value
Absolute change
Change from previous value
jan 1, 1982
2.65 trl
+2.65 trl
0.0%
jan 1, 1983
2.897 trl
+246.79 bln
9.31%
jan 1, 1984
3.066 trl
+168.947 bln
5.83%
jan 1, 1985
3.249 trl
+183.362 bln
5.98%
jan 1, 1986
3.475 trl
+226.032 bln
6.96%
jan 1, 1987
4.342 trl
+866.646 bln
24.94%
jan 1, 1988
5.28 trl
+938.146 bln
21.61%
jan 1, 1989
5.308 trl
+27.677 bln
0.52%
jan 1, 1990
5.49 trl
+181.982 bln
3.43%
jan 1, 1991
5.429 trl
-60.608 bln
-1.1%
jan 1, 1992
4.956 trl
-473.115 bln
-8.71%
jan 1, 1993
4.495 trl
-461.187 bln
-9.31%
jan 1, 1994
4.342 trl
-153.174 bln
-3.41%
jan 1, 1995
4.416 trl
+74.435 bln
1.71%
jan 1, 1996
4.637 trl
+221.268 bln
5.01%
jan 1, 1997
4.723 trl
+85.429 bln
1.84%
jan 1, 1998
4.851 trl
+127.944 bln
2.71%
jan 1, 1999
4.976 trl
+125.765 bln
2.59%
jan 1, 2000
5.075 trl
+98.646 bln
1.98%
jan 1, 2001
4.982 trl
-92.736 bln
-1.83%
jan 1, 2002
5.019 trl
+36.504 bln
0.73%
jan 1, 2003
5.22 trl
+201.421 bln
4.01%
jan 1, 2004
5.595 trl
+374.305 bln
7.17%
jan 1, 2005
6.161 trl
+566.712 bln
10.13%
jan 1, 2006
6.654 trl
+492.759 bln
8.0%
jan 1, 2007
7.114 trl
+459.765 bln
6.91%
jan 1, 2008
7.875 trl
+761.001 bln
10.7%
jan 1, 2009
8.492 trl
+617.58 bln
7.84%
jan 1, 2010
8.58 trl
+87.545 bln
1.03%
jan 1, 2011
8.758 trl
+178.283 bln
2.08%
jan 1, 2012
9.817 trl
+1.059 trl
12.09%
jan 1, 2013
11.109 trl
+1.292 trl
13.16%
jan 1, 2014
12.412 trl
+1.303 trl
11.73%
jan 1, 2015
13.701 trl
+1.289 trl
10.38%
jan 1, 2016
14.47 trl
+769.275 bln
5.61%
Ranking of countries by current statistics by years


Comments: