29
/
en
AIzaSyAYiBZKx7MnpbEhh9jyipgxe19OcubqV5w
April 1, 2024
68878
Antigua and Barbuda
ATG
true
2
1
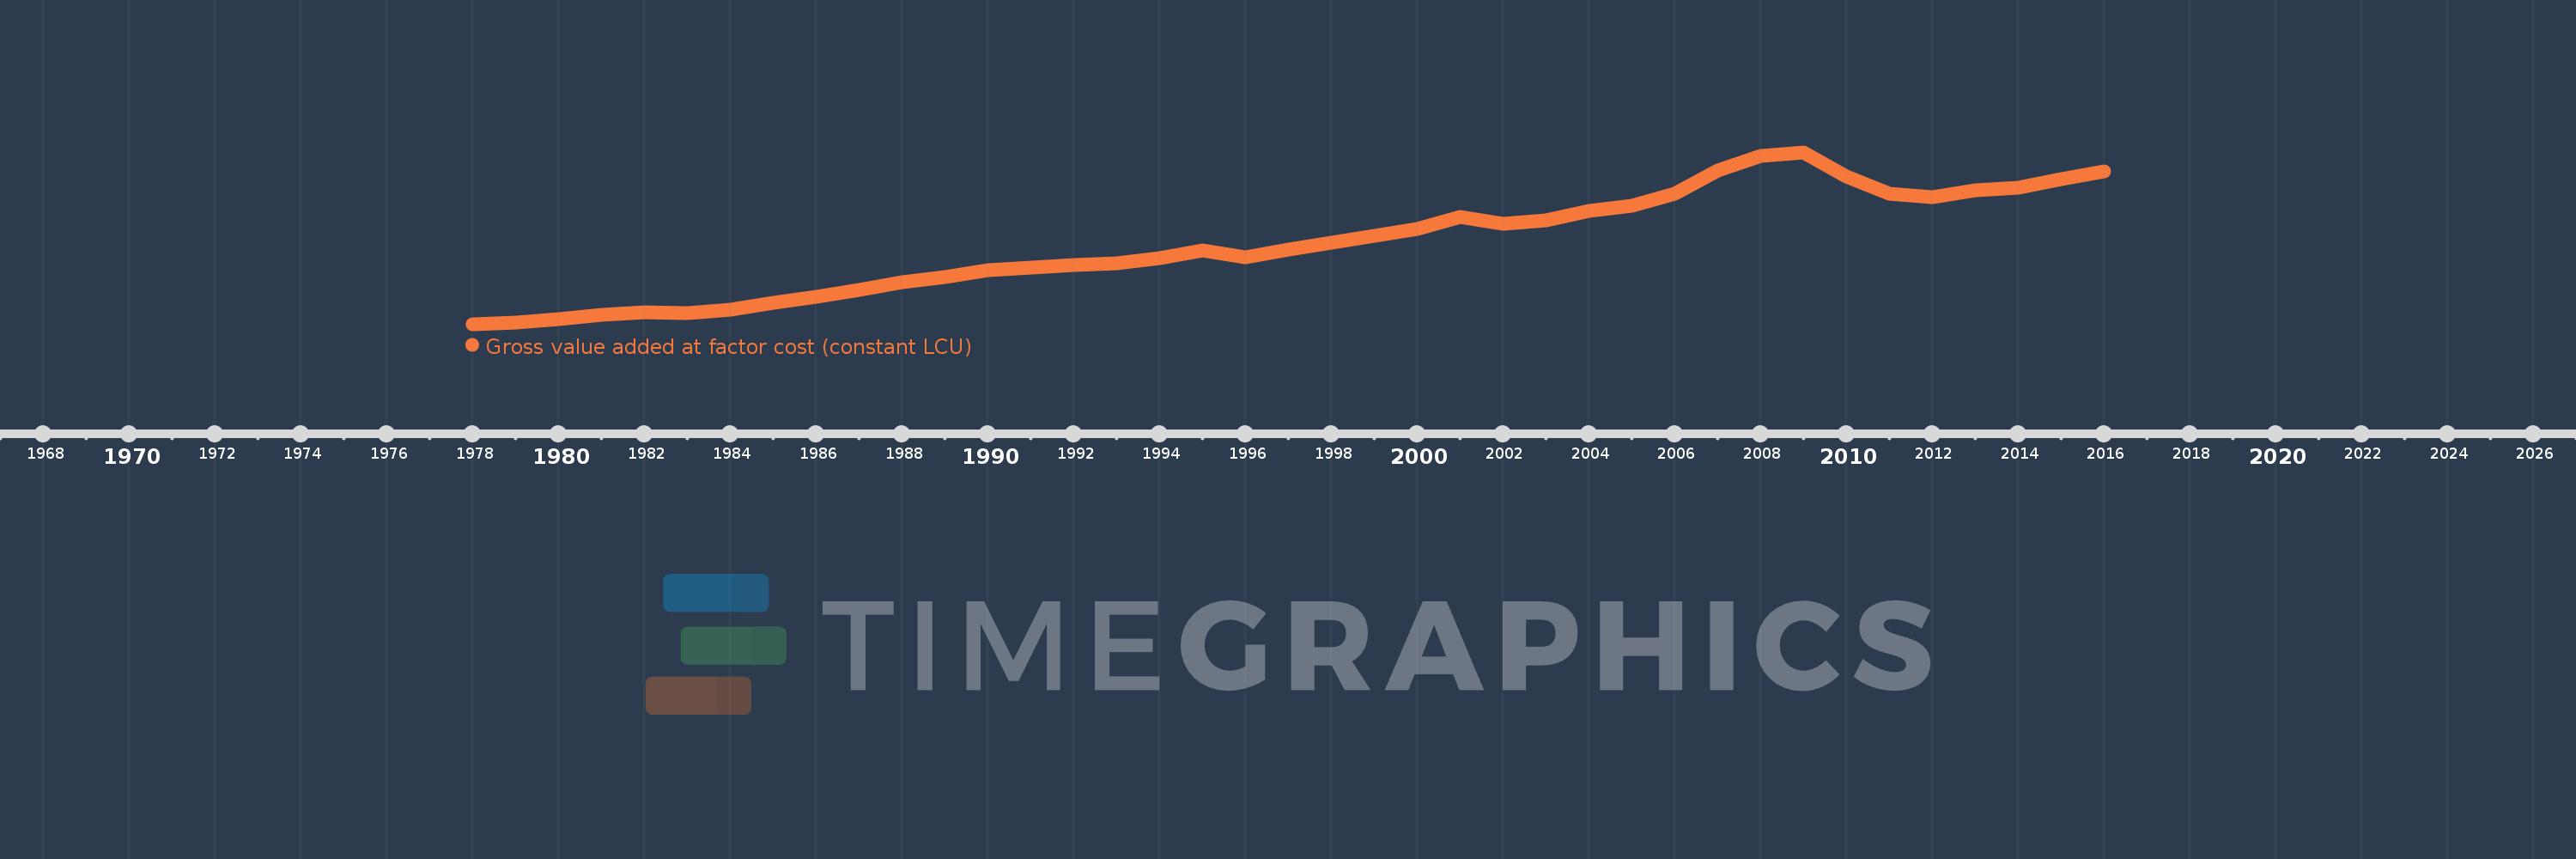
Gross value added at factor cost (constant LCU)
2016,2015,2014,2013,2012,2011,2010,2009,2008,2007,2006,2005,2004,2003,2002,2001,2000,1999,1998,1997,1996,1995,1994,1993,1992,1991,1990,1989,1988,1987,1986,1985,1984,1983,1982,1981,1980,1979,1978
This statistics in other country:
AfghanistanAlbaniaAlgeriaAntigua and BarbudaArgentinaArmeniaAustraliaAustriaAzerbaijanBahamas, TheBangladeshBelarusBelgiumBelizeBeninBermudaBhutanBoliviaBosnia and HerzegovinaBotswanaBrazilBulgariaBurkina FasoBurundiCabo VerdeCambodiaCameroonCanadaCayman IslandsCentral African RepublicChadChileColombiaCongo, Dem. Rep.Costa RicaCote d'IvoireCroatiaCubaCyprusCzech RepublicDenmarkDjiboutiDominicaDominican RepublicEcuadorEgypt, Arab Rep.El SalvadorEquatorial GuineaEritreaEstoniaEthiopiaFijiFinlandFranceGabonGambia, TheGeorgiaGermanyGhanaGreeceGrenadaGuatemalaGuineaGuinea-BissauGuyanaHaitiHondurasHong Kong SAR, ChinaHungaryIcelandIndiaIndonesiaIran, Islamic Rep.IrelandItalyJamaicaJapanJordanKazakhstanKenyaKiribatiKorea, Rep.KosovoKuwaitKyrgyz RepublicLao PDRLatviaLebanonLesothoLiberiaLithuaniaLuxembourgMacedonia, FYRMadagascarMalawiMaldivesMaliMarshall IslandsMauritaniaMauritiusMexicoMicronesia, Fed. Sts.MoldovaMongoliaMontenegroMoroccoMozambiqueNamibiaNepalNetherlandsNew ZealandNicaraguaNigeriaNorwayOmanPakistanPalauPanamaPapua New GuineaParaguayPeruPhilippinesPolandPortugalRomaniaRussian FederationRwandaSao Tome and PrincipeSenegalSerbiaSeychellesSierra LeoneSingaporeSlovak RepublicSloveniaSolomon IslandsSomaliaSouth AfricaSpainSri LankaSt. Kitts and NevisSt. LuciaSt. Vincent and the GrenadinesSudanSurinameSwazilandSwedenSwitzerlandSyrian Arab RepublicTajikistanTanzaniaThailandTimor-LesteTongaTrinidad and TobagoTunisiaTurkeyTurkmenistanTuvaluUgandaUkraineUnited Arab EmiratesUnited KingdomUnited StatesUruguayUzbekistanVanuatuVenezuela, RBVietnamWest Bank and GazaZambiaZimbabwe Timeline:
This timeline shows a graph from 1978 to 2016 of Antigua and Barbuda. No data until 1977. Number of actual observations by date: 39.
Source name:
World Development Indicators
Source organization:
World Bank national accounts data, and OECD National Accounts data files.
Categories, topics:
Economy & Growth
Last updated:
apr 23, 2017
Indicators value changes by year
Minimum:
670.022 mln
jan 1, 1978
Maximum:
2.878 bln
jan 1, 2009
At the date of observation
Value
Absolute change
Change from previous value
jan 1, 1978
670.022 mln
+670.022 mln
0.0%
jan 1, 1979
688.531 mln
+18.509 mln
2.76%
jan 1, 1980
736.194 mln
+47.663 mln
6.92%
jan 1, 1981
792.283 mln
+56.089 mln
7.62%
jan 1, 1982
820.688 mln
+28.404 mln
3.59%
jan 1, 1983
812.84 mln
-7.848 mln
-0.96%
jan 1, 1984
859.925 mln
+47.085 mln
5.79%
jan 1, 1985
944.528 mln
+84.603 mln
9.84%
jan 1, 1986
1.019 bln
+74.895 mln
7.93%
jan 1, 1987
1.11 bln
+90.793 mln
8.91%
jan 1, 1988
1.21 bln
+99.688 mln
8.98%
jan 1, 1989
1.279 bln
+68.611 mln
5.67%
jan 1, 1990
1.366 bln
+87.291 mln
6.83%
jan 1, 1991
1.397 bln
+31.077 mln
2.28%
jan 1, 1992
1.435 bln
+38.096 mln
2.73%
jan 1, 1993
1.447 bln
+12.162 mln
0.85%
jan 1, 1994
1.521 bln
+73.551 mln
5.08%
jan 1, 1995
1.615 bln
+93.857 mln
6.17%
jan 1, 1996
1.535 bln
-79.678 mln
-4.94%
jan 1, 1997
1.628 bln
+92.904 mln
6.05%
jan 1, 1998
1.718 bln
+90.574 mln
5.56%
jan 1, 1999
1.803 bln
+84.853 mln
4.94%
jan 1, 2000
1.892 bln
+88.636 mln
4.92%
jan 1, 2001
2.048 bln
+155.732 mln
8.23%
jan 1, 2002
1.957 bln
-90.173 mln
-4.4%
jan 1, 2003
2.007 bln
+49.598 mln
2.53%
jan 1, 2004
2.122 bln
+114.51 mln
5.71%
jan 1, 2005
2.19 bln
+68.652 mln
3.24%
jan 1, 2006
2.348 bln
+158.002 mln
7.21%
jan 1, 2007
2.647 bln
+298.573 mln
12.72%
jan 1, 2008
2.834 bln
+187.126 mln
7.07%
jan 1, 2009
2.878 bln
+43.699 mln
1.54%
jan 1, 2010
2.571 bln
-306.919 mln
-10.67%
jan 1, 2011
2.351 bln
-219.235 mln
-8.53%
jan 1, 2012
2.308 bln
-43.89 mln
-1.87%
jan 1, 2013
2.386 bln
+78.25 mln
3.39%
jan 1, 2014
2.421 bln
+35.441 mln
1.49%
jan 1, 2015
2.536 bln
+114.658 mln
4.74%
jan 1, 2016
2.632 bln
+96.621 mln
3.81%
Ranking of countries by current statistics by years


Comments: