29
/
en
AIzaSyAYiBZKx7MnpbEhh9jyipgxe19OcubqV5w
April 1, 2024
183944
Macedonia, FYR
MKD
true
2
1
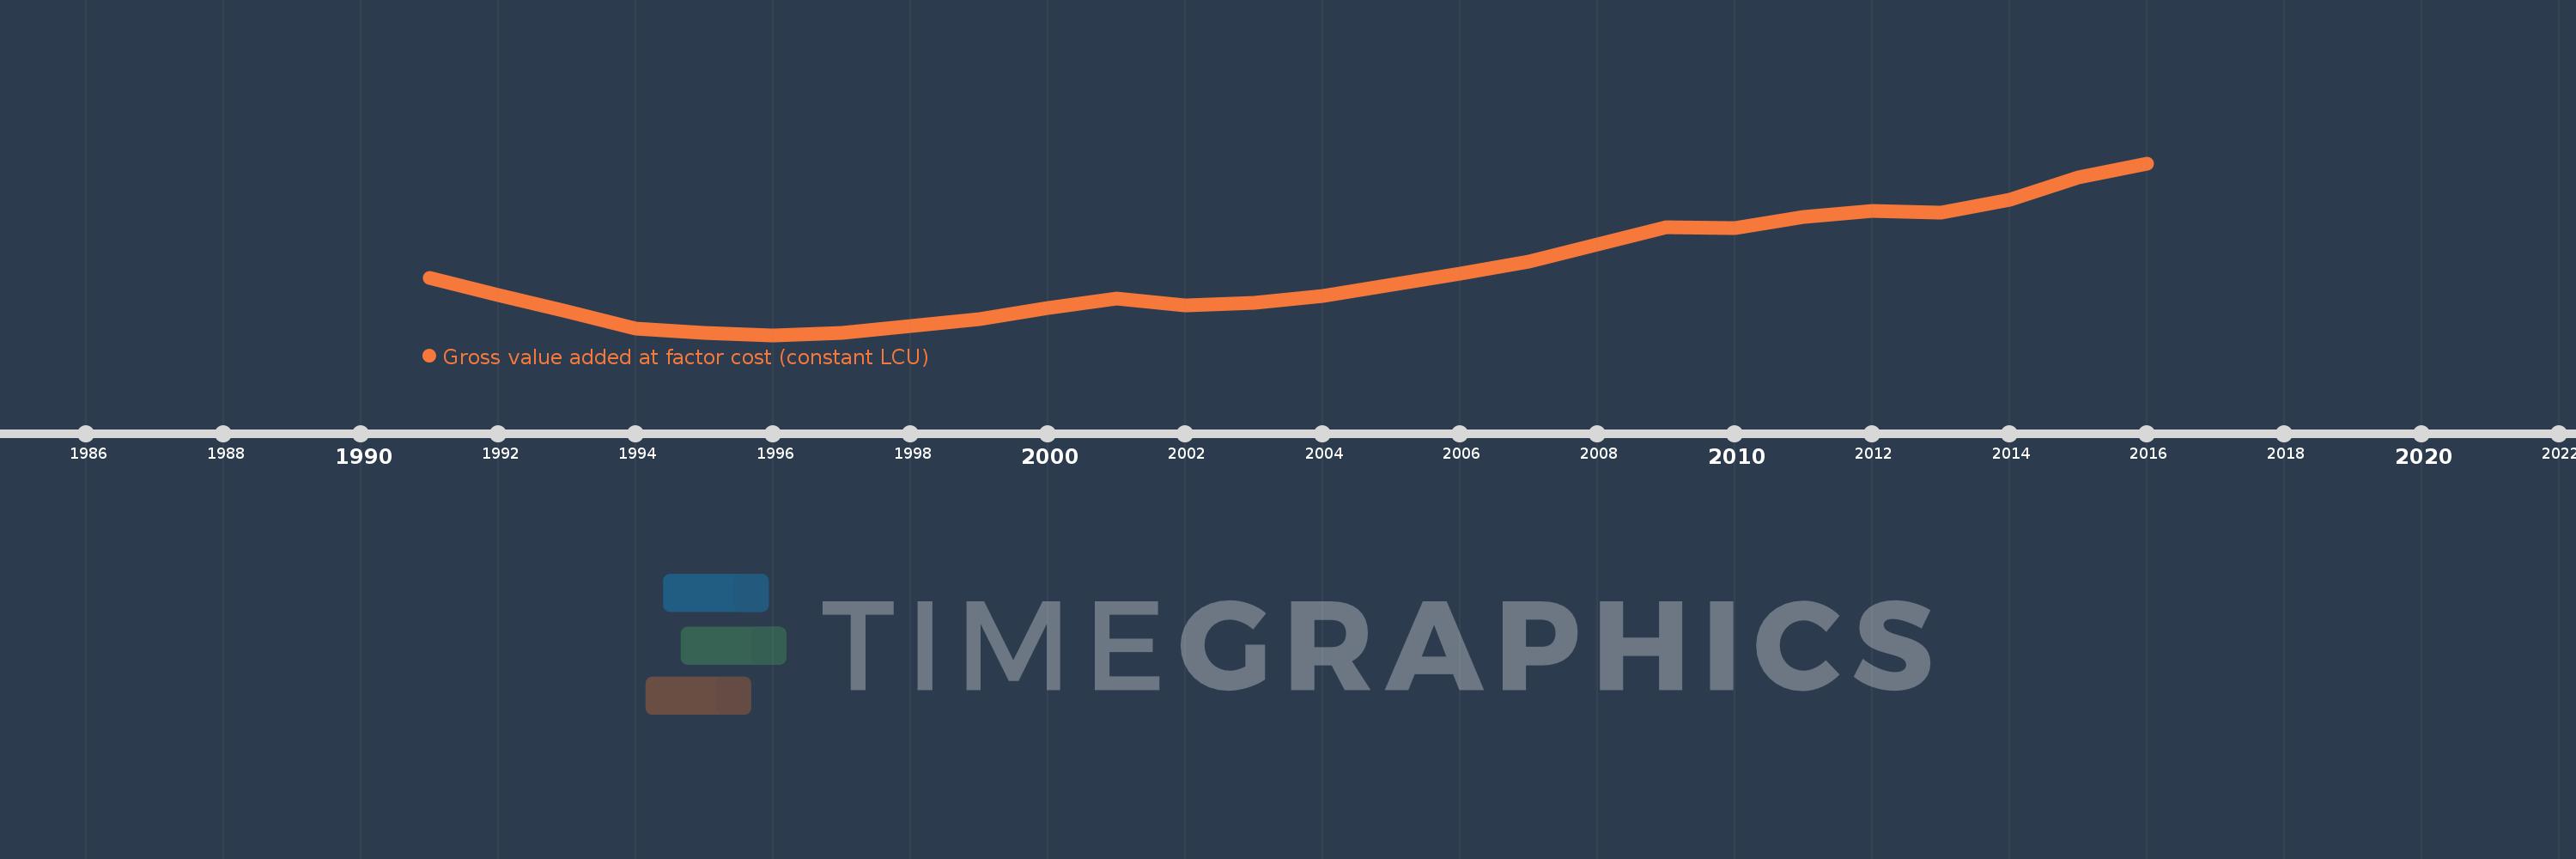
Gross value added at factor cost (constant LCU)
2016,2015,2014,2013,2012,2011,2010,2009,2008,2007,2006,2005,2004,2003,2002,2001,2000,1999,1998,1997,1996,1995,1994,1993,1992,1991
This statistics in other country:
AfghanistanAlbaniaAlgeriaAntigua and BarbudaArgentinaArmeniaAustraliaAustriaAzerbaijanBahamas, TheBangladeshBelarusBelgiumBelizeBeninBermudaBhutanBoliviaBosnia and HerzegovinaBotswanaBrazilBulgariaBurkina FasoBurundiCabo VerdeCambodiaCameroonCanadaCayman IslandsCentral African RepublicChadChileColombiaCongo, Dem. Rep.Costa RicaCote d'IvoireCroatiaCubaCyprusCzech RepublicDenmarkDjiboutiDominicaDominican RepublicEcuadorEgypt, Arab Rep.El SalvadorEquatorial GuineaEritreaEstoniaEthiopiaFijiFinlandFranceGabonGambia, TheGeorgiaGermanyGhanaGreeceGrenadaGuatemalaGuineaGuinea-BissauGuyanaHaitiHondurasHong Kong SAR, ChinaHungaryIcelandIndiaIndonesiaIran, Islamic Rep.IrelandItalyJamaicaJapanJordanKazakhstanKenyaKiribatiKorea, Rep.KosovoKuwaitKyrgyz RepublicLao PDRLatviaLebanonLesothoLiberiaLithuaniaLuxembourgMacedonia, FYRMadagascarMalawiMaldivesMaliMarshall IslandsMauritaniaMauritiusMexicoMicronesia, Fed. Sts.MoldovaMongoliaMontenegroMoroccoMozambiqueNamibiaNepalNetherlandsNew ZealandNicaraguaNigeriaNorwayOmanPakistanPalauPanamaPapua New GuineaParaguayPeruPhilippinesPolandPortugalRomaniaRussian FederationRwandaSao Tome and PrincipeSenegalSerbiaSeychellesSierra LeoneSingaporeSlovak RepublicSloveniaSolomon IslandsSomaliaSouth AfricaSpainSri LankaSt. Kitts and NevisSt. LuciaSt. Vincent and the GrenadinesSudanSurinameSwazilandSwedenSwitzerlandSyrian Arab RepublicTajikistanTanzaniaThailandTimor-LesteTongaTrinidad and TobagoTunisiaTurkeyTurkmenistanTuvaluUgandaUkraineUnited Arab EmiratesUnited KingdomUnited StatesUruguayUzbekistanVanuatuVenezuela, RBVietnamWest Bank and GazaZambiaZimbabwe Timeline:
This timeline shows a graph from 1991 to 2016 of Macedonia, FYR. No data until 1990. Number of actual observations by date: 26.
Source name:
World Development Indicators
Source organization:
World Bank national accounts data, and OECD National Accounts data files.
Categories, topics:
Economy & Growth
Last updated:
apr 23, 2017
Indicators value changes by year
Minimum:
205.173 bln
jan 1, 1996
Maximum:
371.924 bln
jan 1, 2016
At the date of observation
Value
Absolute change
Change from previous value
jan 1, 1991
260.35 bln
+260.35 bln
0.0%
jan 1, 1992
244.285 bln
-16.066 bln
-6.17%
jan 1, 1993
228.248 bln
-16.037 bln
-6.56%
jan 1, 1994
211.199 bln
-17.049 bln
-7.47%
jan 1, 1995
207.485 bln
-3.714 bln
-1.76%
jan 1, 1996
205.173 bln
-2.312 bln
-1.11%
jan 1, 1997
207.604 bln
+2.431 bln
1.19%
jan 1, 1998
214.128 bln
+6.523 bln
3.14%
jan 1, 1999
220.988 bln
+6.86 bln
3.2%
jan 1, 2000
231.136 bln
+10.148 bln
4.59%
jan 1, 2001
240.525 bln
+9.389 bln
4.06%
jan 1, 2002
234.05 bln
-6.475 bln
-2.69%
jan 1, 2003
236.797 bln
+2.747 bln
1.17%
jan 1, 2004
242.9 bln
+6.103 bln
2.58%
jan 1, 2005
254.175 bln
+11.275 bln
4.64%
jan 1, 2006
264.847 bln
+10.672 bln
4.2%
jan 1, 2007
276.822 bln
+11.975 bln
4.52%
jan 1, 2008
293.244 bln
+16.422 bln
5.93%
jan 1, 2009
310.039 bln
+16.795 bln
5.73%
jan 1, 2010
309.105 bln
-934.0 mln
-0.3%
jan 1, 2011
319.649 bln
+10.544 bln
3.41%
jan 1, 2012
325.881 bln
+6.232 bln
1.95%
jan 1, 2013
323.71 bln
-2.171 bln
-0.67%
jan 1, 2014
336.383 bln
+12.673 bln
3.91%
jan 1, 2015
358.523 bln
+22.14 bln
6.58%
jan 1, 2016
371.924 bln
+13.401 bln
3.74%
Ranking of countries by current statistics by years


Comments: