29
/
en
AIzaSyAYiBZKx7MnpbEhh9jyipgxe19OcubqV5w
April 1, 2024
95969
Burundi
BDI
true
2
1
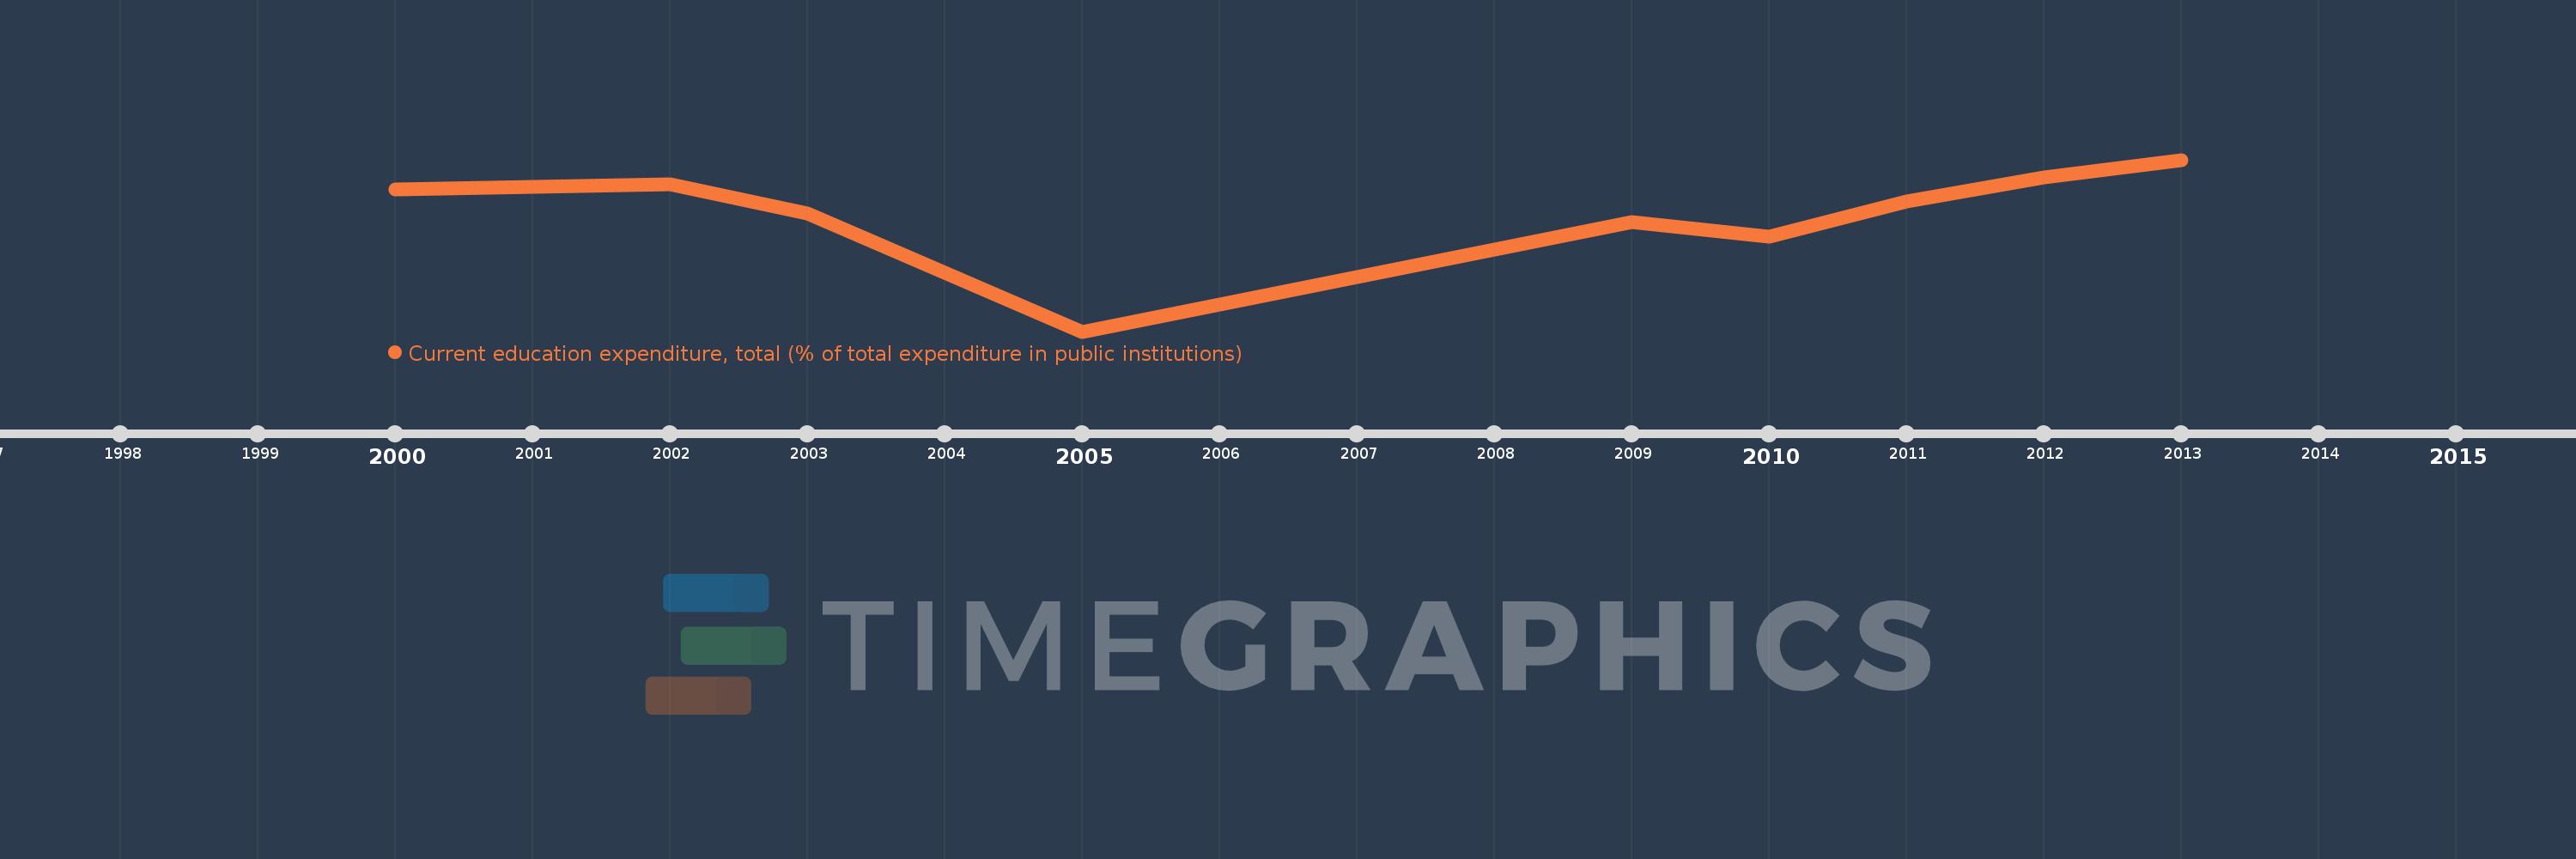
Current education expenditure, total (% of total expenditure in public institutions)
2013,2012,2011,2010,2009,2005,2003,2002,2000
This statistics in other country:
Timeline:
This timeline shows a graph from 2000 to 2013 of Burundi. No data until 1999. Number of actual observations by date: 9.
Source name:
World Development Indicators
Source organization:
United Nations Educational, Scientific, and Cultural Organization (UNESCO) Institute for Statistics.
Categories, topics:
Education
Last updated:
apr 23, 2017
Indicators value changes by year
Minimum:
73.442
jan 1, 2005
Maximum:
98.091
jan 1, 2013
At the date of observation
Value
Absolute change
Change from previous value
jan 1, 2000
93.864
+93.864
0.0%
jan 1, 2002
94.627
+0.763
0.81%
jan 1, 2003
90.355
-4.272
-4.51%
jan 1, 2005
73.442
-16.914
-18.72%
jan 1, 2009
89.13
+15.689
21.36%
jan 1, 2010
87.01
-2.121
-2.38%
jan 1, 2011
92.143
+5.133
5.9%
jan 1, 2012
95.611
+3.468
3.76%
jan 1, 2013
98.091
+2.479
2.59%
Ranking of countries by current statistics by years


Comments: