29
/
en
AIzaSyAYiBZKx7MnpbEhh9jyipgxe19OcubqV5w
April 1, 2024
114652
Croatia
HRV
true
2
1
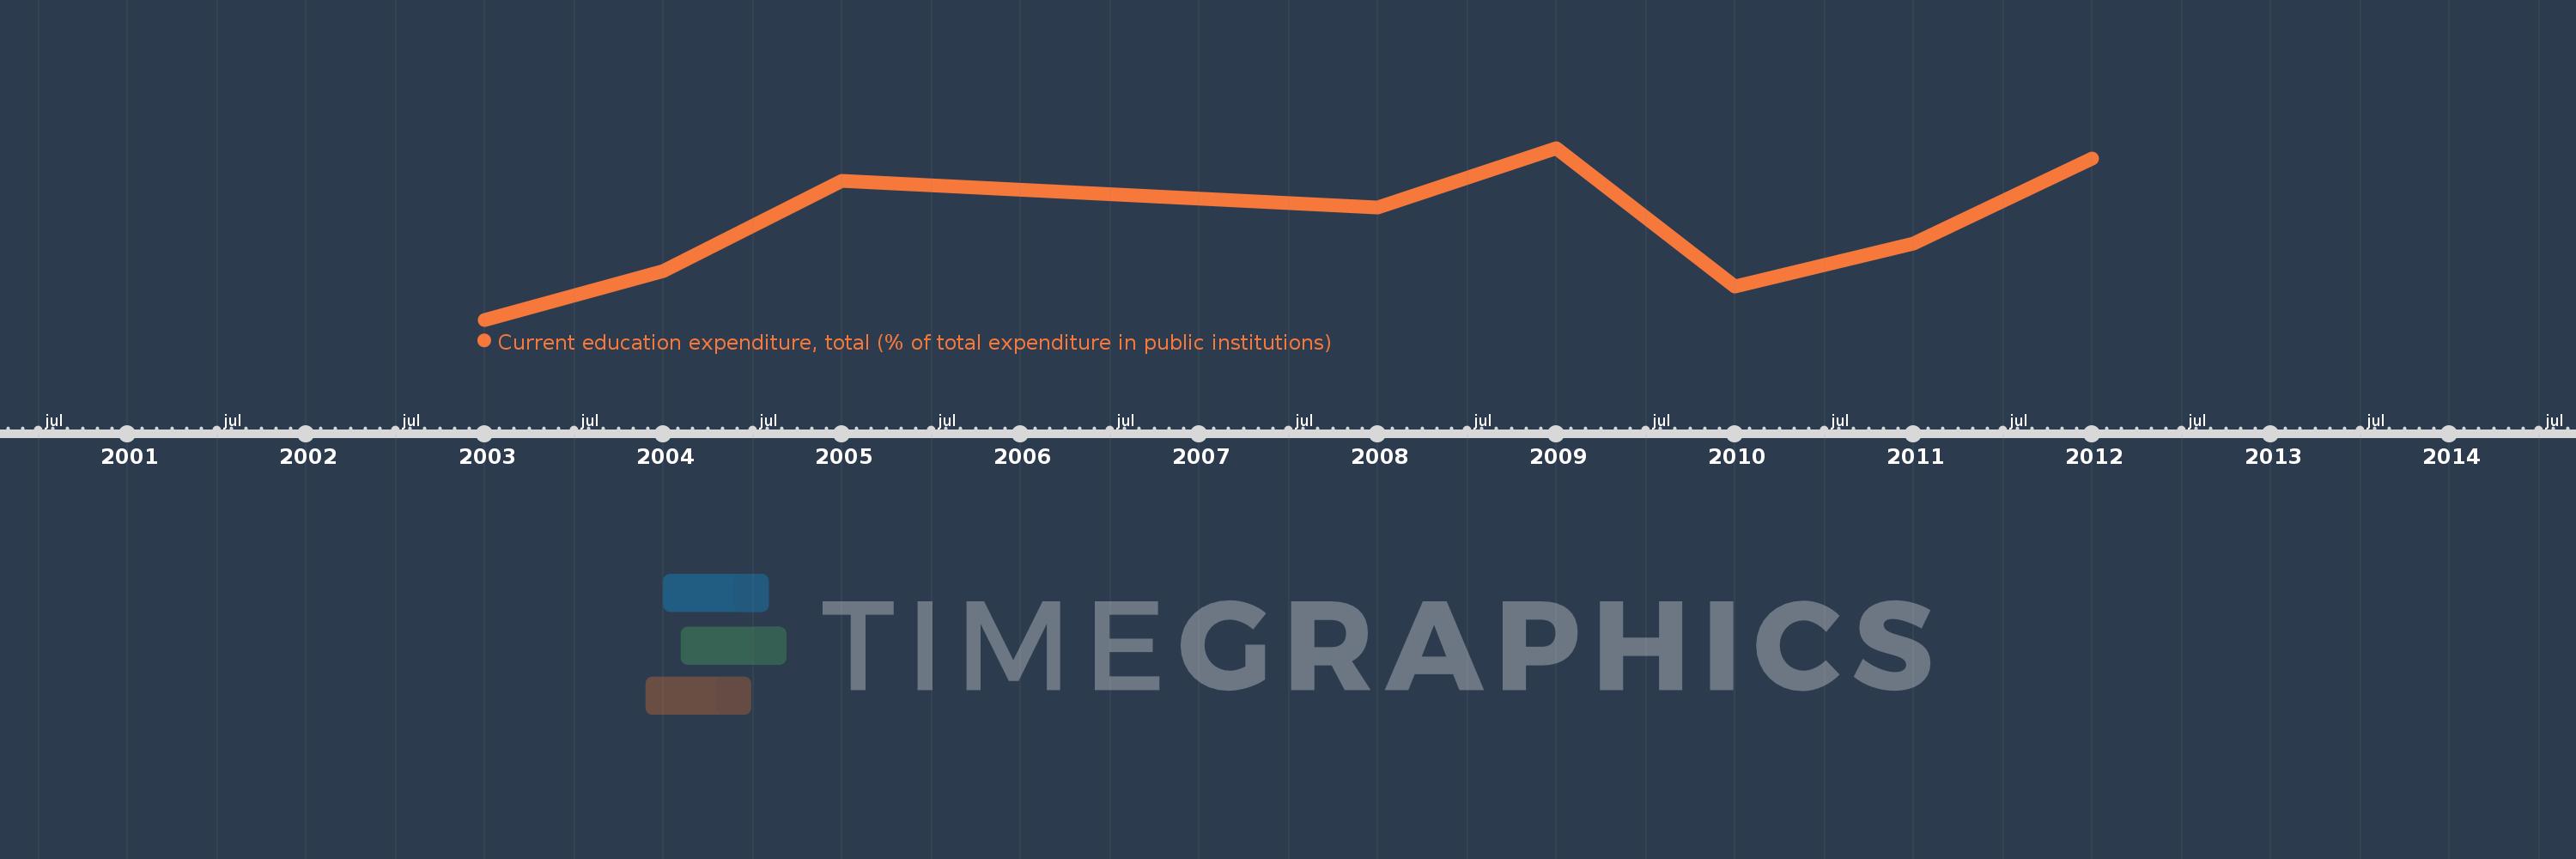
Current education expenditure, total (% of total expenditure in public institutions)
2012,2011,2010,2009,2008,2005,2004,2003
This statistics in other country:
Timeline:
This timeline shows a graph from 2003 to 2012 of Croatia. No data until 2002. Number of actual observations by date: 8.
Source name:
World Development Indicators
Source organization:
United Nations Educational, Scientific, and Cultural Organization (UNESCO) Institute for Statistics.
Categories, topics:
Education
Last updated:
apr 23, 2017
Indicators value changes by year
Minimum:
91.097
jan 1, 2003
Maximum:
96.633
jan 1, 2009
At the date of observation
Value
Absolute change
Change from previous value
jan 1, 2003
91.097
+91.097
0.0%
jan 1, 2004
92.677
+1.58
1.73%
jan 1, 2005
95.571
+2.895
3.12%
jan 1, 2008
94.703
-0.868
-0.91%
jan 1, 2009
96.633
+1.929
2.04%
jan 1, 2010
92.178
-4.455
-4.61%
jan 1, 2011
93.551
+1.373
1.49%
jan 1, 2012
96.286
+2.734
2.92%
Ranking of countries by current statistics by years


Comments: