29
/
en
AIzaSyAYiBZKx7MnpbEhh9jyipgxe19OcubqV5w
April 1, 2024
185021
Madagascar
MDG
true
2
1
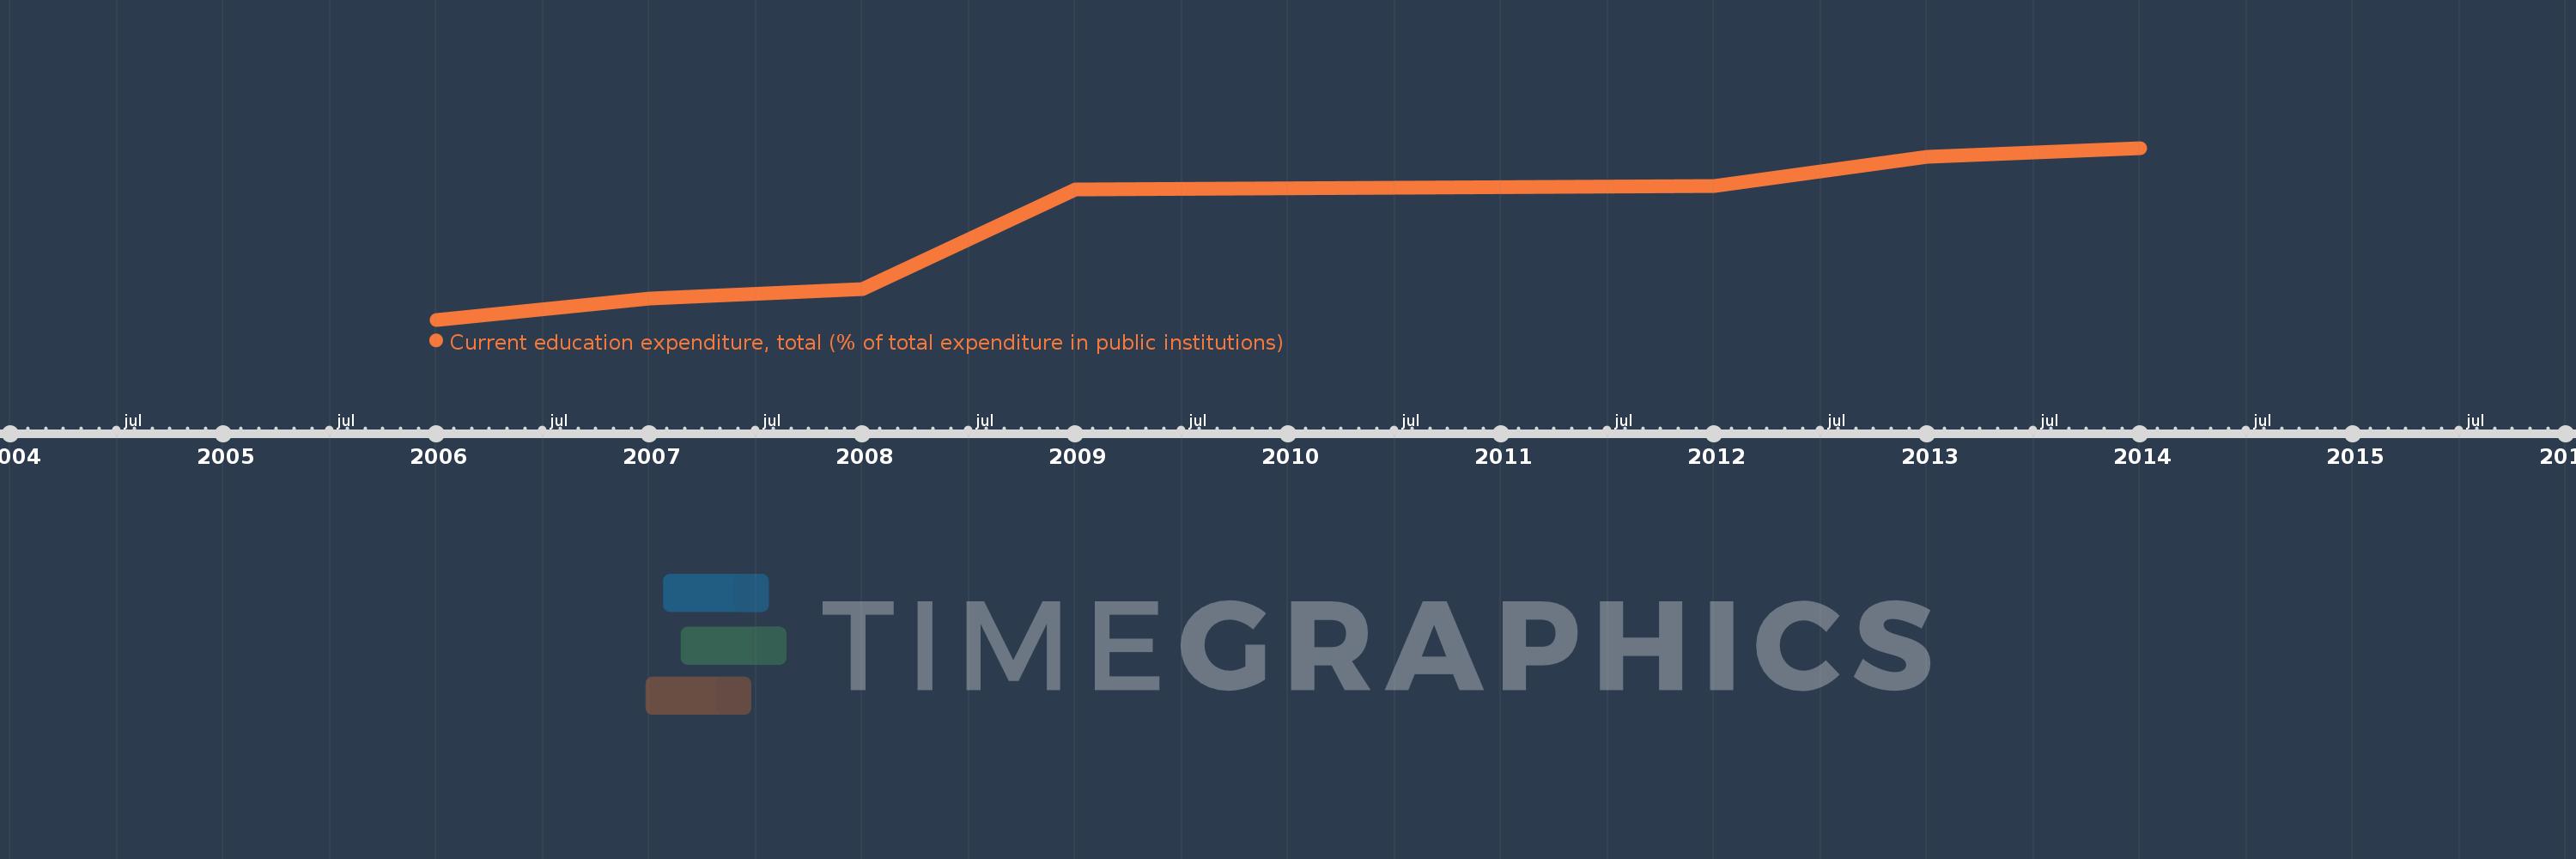
Current education expenditure, total (% of total expenditure in public institutions)
2014,2013,2012,2009,2008,2007,2006
This statistics in other country:
Timeline:
This timeline shows a graph from 2006 to 2014 of Madagascar. No data until 2005. Number of actual observations by date: 7.
Source name:
World Development Indicators
Source organization:
United Nations Educational, Scientific, and Cultural Organization (UNESCO) Institute for Statistics.
Categories, topics:
Education
Last updated:
apr 23, 2017
Indicators value changes by year
Minimum:
68.222
jan 1, 2006
Maximum:
96.925
jan 1, 2014
At the date of observation
Value
Absolute change
Change from previous value
jan 1, 2006
68.222
+68.222
0.0%
jan 1, 2007
71.832
+3.609
5.29%
jan 1, 2008
73.3
+1.468
2.04%
jan 1, 2009
89.973
+16.673
22.75%
jan 1, 2012
90.627
+0.654
0.73%
jan 1, 2013
95.412
+4.785
5.28%
jan 1, 2014
96.925
+1.513
1.59%
Ranking of countries by current statistics by years


Comments: