29
/
en
AIzaSyAYiBZKx7MnpbEhh9jyipgxe19OcubqV5w
April 1, 2024
152366
Hungary
HUN
true
2
1
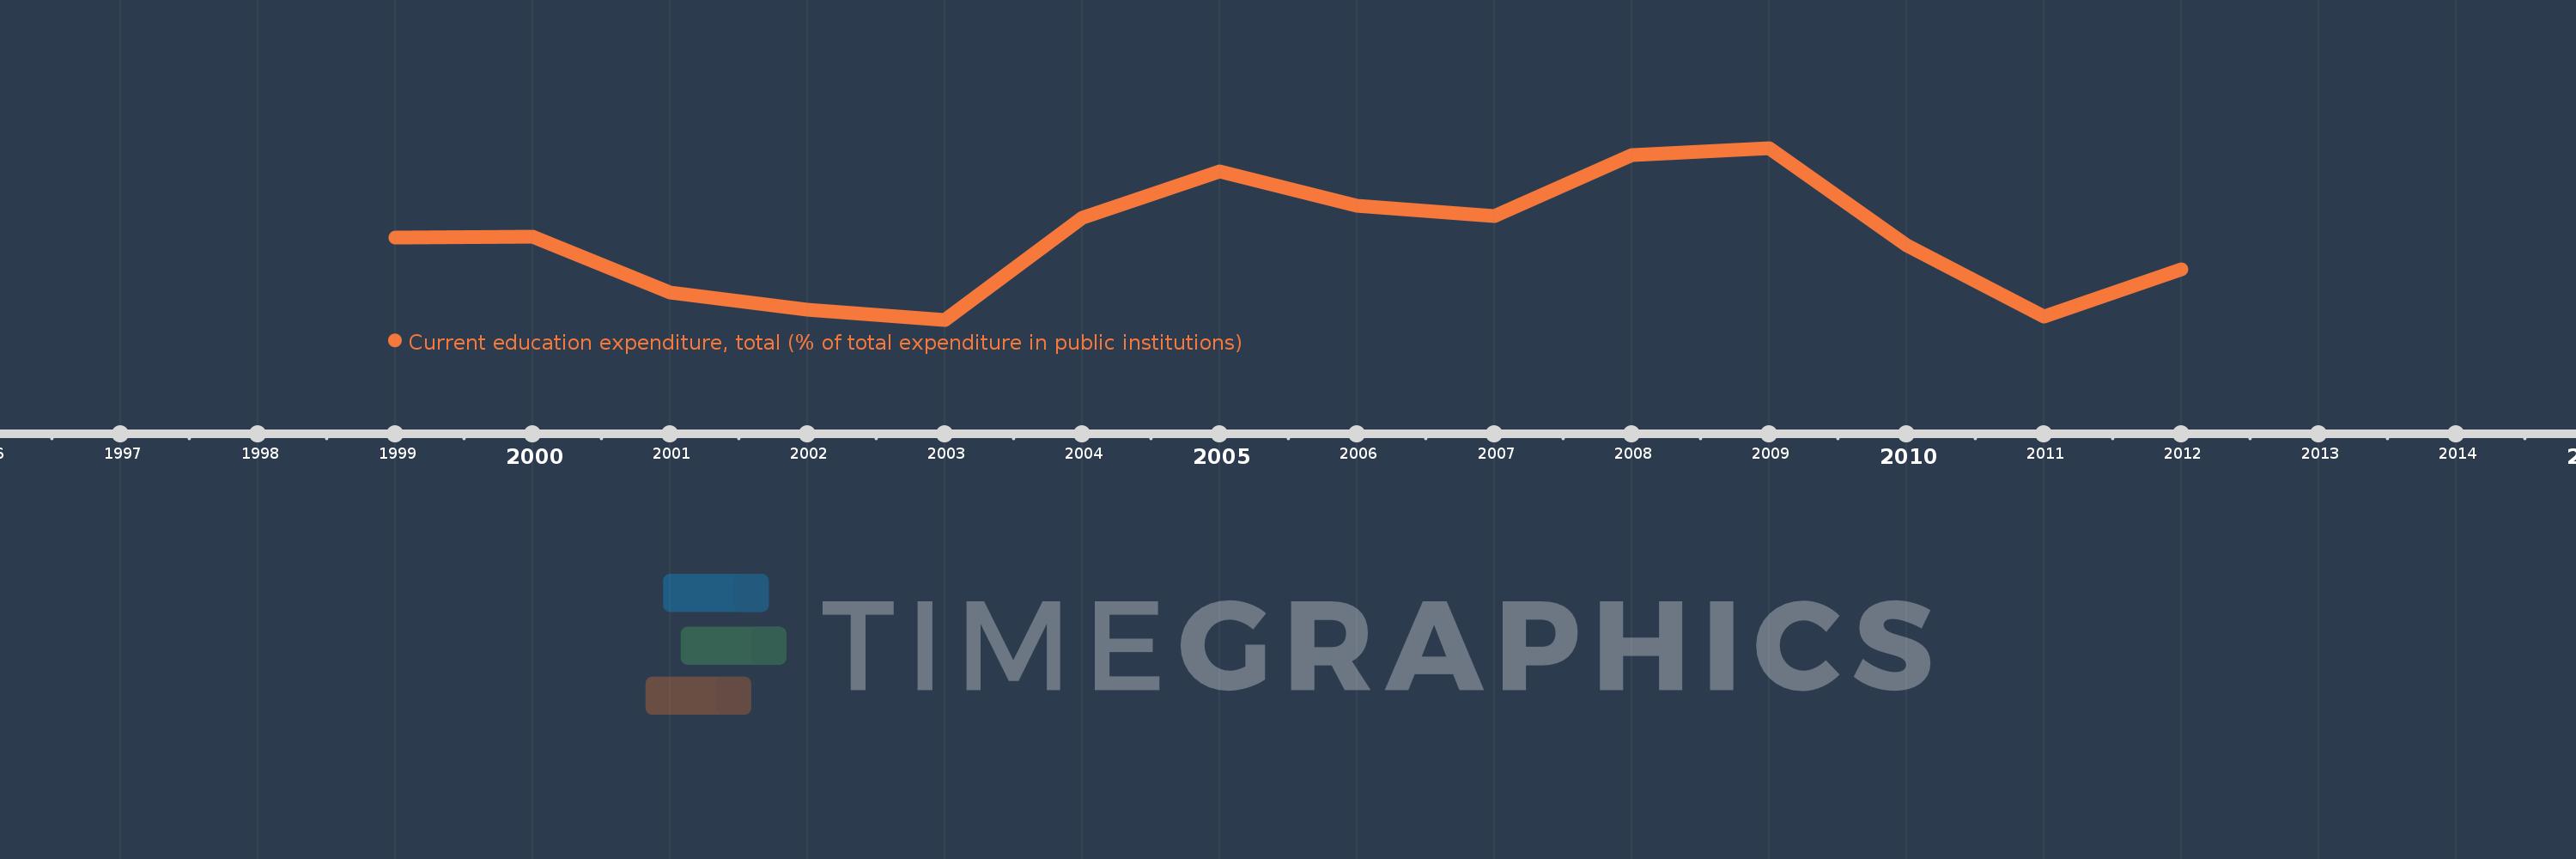
Current education expenditure, total (% of total expenditure in public institutions)
2012,2011,2010,2009,2008,2007,2006,2005,2004,2003,2002,2001,2000,1999
This statistics in other country:
Timeline:
This timeline shows a graph from 1999 to 2012 of Hungary. No data until 1998. Number of actual observations by date: 14.
Source name:
World Development Indicators
Source organization:
United Nations Educational, Scientific, and Cultural Organization (UNESCO) Institute for Statistics.
Categories, topics:
Education
Last updated:
apr 23, 2017
Indicators value changes by year
Minimum:
89.542
jan 1, 2003
At the date of observation
Value
Absolute change
Change from previous value
jan 1, 1999
91.786
+91.786
0.0%
jan 1, 2000
91.796
+0.01
0.01%
jan 1, 2001
90.282
-1.514
-1.65%
jan 1, 2002
89.818
-0.464
-0.51%
jan 1, 2003
89.542
-0.277
-0.31%
jan 1, 2004
92.327
+2.785
3.11%
jan 1, 2005
93.581
+1.254
1.36%
jan 1, 2006
92.636
-0.945
-1.01%
jan 1, 2007
92.375
-0.261
-0.28%
jan 1, 2008
94.028
+1.654
1.79%
jan 1, 2009
94.22
+0.192
0.2%
jan 1, 2010
91.577
-2.643
-2.8%
jan 1, 2011
89.63
-1.947
-2.13%
jan 1, 2012
90.911
+1.28
1.43%
Ranking of countries by current statistics by years


Comments: